West Indian vs Immigrants from St. Vincent and the Grenadines Unemployment Among Ages 25 to 29 years
COMPARE
West Indian
Immigrants from St. Vincent and the Grenadines
Unemployment Among Ages 25 to 29 years
Unemployment Among Ages 25 to 29 years Comparison
West Indians
Immigrants from St. Vincent and the Grenadines
7.9%
UNEMPLOYMENT AMONG AGES 25 TO 29 YEARS
0.0/ 100
METRIC RATING
301st/ 347
METRIC RANK
8.4%
UNEMPLOYMENT AMONG AGES 25 TO 29 YEARS
0.0/ 100
METRIC RATING
313th/ 347
METRIC RANK
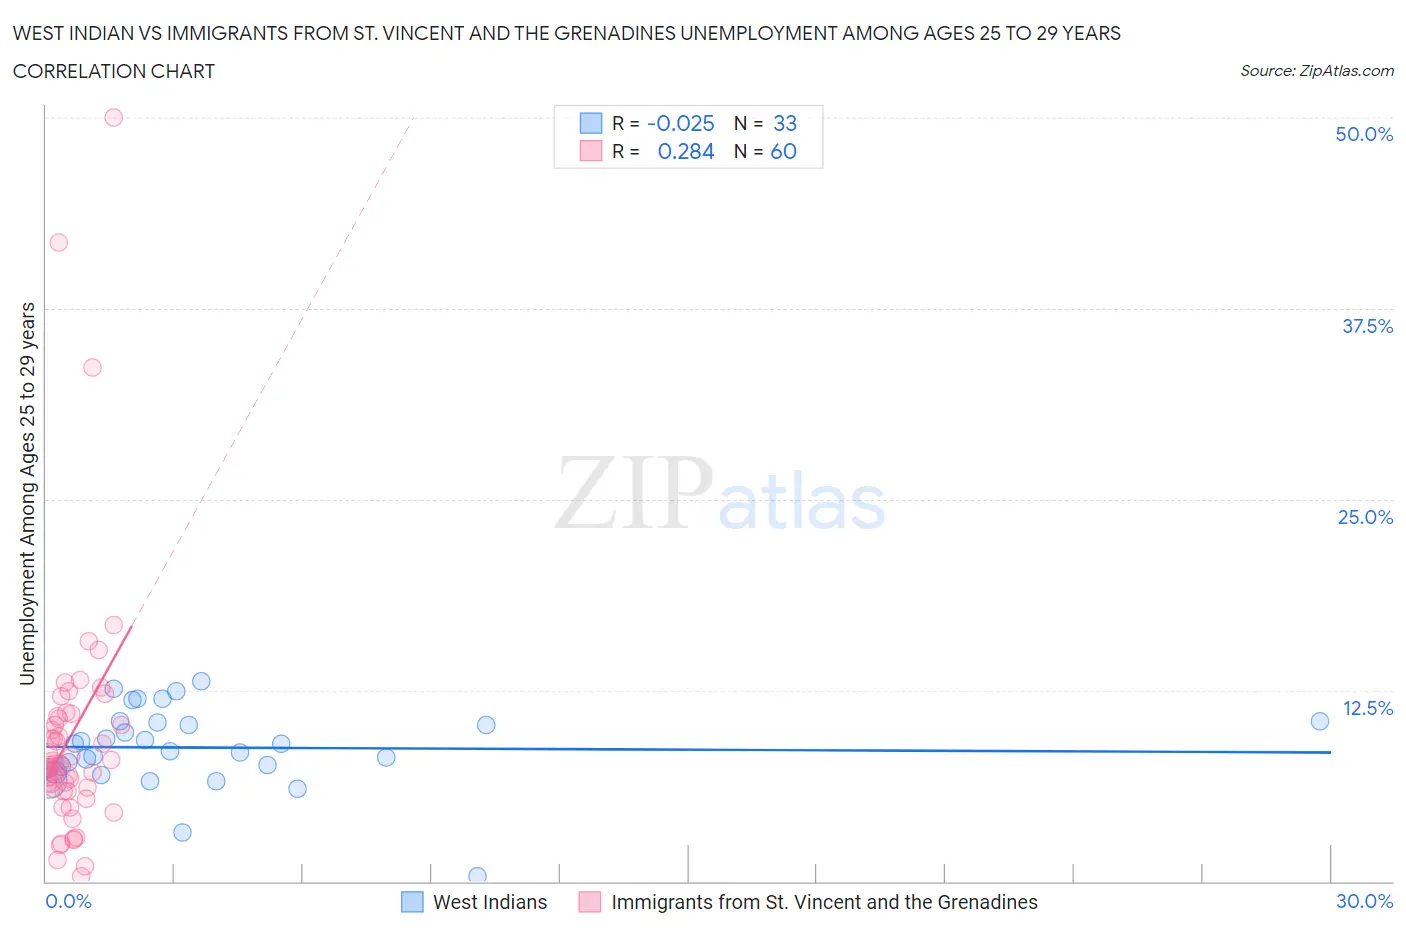
West Indian vs Immigrants from St. Vincent and the Grenadines Unemployment Among Ages 25 to 29 years Correlation Chart
The statistical analysis conducted on geographies consisting of 247,262,358 people shows no correlation between the proportion of West Indians and unemployment rate among population between the ages 25 and 29 in the United States with a correlation coefficient (R) of -0.025 and weighted average of 7.9%. Similarly, the statistical analysis conducted on geographies consisting of 55,669,457 people shows a weak positive correlation between the proportion of Immigrants from St. Vincent and the Grenadines and unemployment rate among population between the ages 25 and 29 in the United States with a correlation coefficient (R) of 0.284 and weighted average of 8.4%, a difference of 5.8%.
Unemployment Among Ages 25 to 29 years Correlation Summary
| Measurement | West Indian | Immigrants from St. Vincent and the Grenadines |
| Minimum | 0.30% | 0.30% |
| Maximum | 13.1% | 50.0% |
| Range | 12.8% | 49.7% |
| Mean | 8.7% | 9.5% |
| Median | 9.0% | 7.7% |
| Interquartile 25% (IQ1) | 7.3% | 6.0% |
| Interquartile 75% (IQ3) | 10.4% | 10.7% |
| Interquartile Range (IQR) | 3.1% | 4.7% |
| Standard Deviation (Sample) | 2.7% | 8.4% |
| Standard Deviation (Population) | 2.6% | 8.3% |
Demographics Similar to West Indians and Immigrants from St. Vincent and the Grenadines by Unemployment Among Ages 25 to 29 years
In terms of unemployment among ages 25 to 29 years, the demographic groups most similar to West Indians are Central American Indian (7.9%, a difference of 0.030%), Barbadian (7.9%, a difference of 0.050%), Jamaican (7.9%, a difference of 0.16%), Immigrants from Trinidad and Tobago (7.9%, a difference of 0.22%), and Blackfeet (7.9%, a difference of 0.48%). Similarly, the demographic groups most similar to Immigrants from St. Vincent and the Grenadines are Immigrants from Dominica (8.4%, a difference of 0.35%), British West Indian (8.4%, a difference of 0.94%), Immigrants from Grenada (8.4%, a difference of 1.0%), Immigrants from Guyana (8.5%, a difference of 1.1%), and Dutch West Indian (8.2%, a difference of 2.1%).
| Demographics | Rating | Rank | Unemployment Among Ages 25 to 29 years |
| Blackfeet | 0.0 /100 | #297 | Tragic 7.9% |
| Immigrants | Trinidad and Tobago | 0.0 /100 | #298 | Tragic 7.9% |
| Barbadians | 0.0 /100 | #299 | Tragic 7.9% |
| Central American Indians | 0.0 /100 | #300 | Tragic 7.9% |
| West Indians | 0.0 /100 | #301 | Tragic 7.9% |
| Jamaicans | 0.0 /100 | #302 | Tragic 7.9% |
| Immigrants | Yemen | 0.0 /100 | #303 | Tragic 8.0% |
| Cajuns | 0.0 /100 | #304 | Tragic 8.0% |
| Tsimshian | 0.0 /100 | #305 | Tragic 8.0% |
| Haitians | 0.0 /100 | #306 | Tragic 8.0% |
| Immigrants | Barbados | 0.0 /100 | #307 | Tragic 8.0% |
| Immigrants | Jamaica | 0.0 /100 | #308 | Tragic 8.1% |
| Immigrants | Haiti | 0.0 /100 | #309 | Tragic 8.1% |
| U.S. Virgin Islanders | 0.0 /100 | #310 | Tragic 8.1% |
| Immigrants | Azores | 0.0 /100 | #311 | Tragic 8.1% |
| Dutch West Indians | 0.0 /100 | #312 | Tragic 8.2% |
| Immigrants | St. Vincent and the Grenadines | 0.0 /100 | #313 | Tragic 8.4% |
| Immigrants | Dominica | 0.0 /100 | #314 | Tragic 8.4% |
| British West Indians | 0.0 /100 | #315 | Tragic 8.4% |
| Immigrants | Grenada | 0.0 /100 | #316 | Tragic 8.4% |
| Immigrants | Guyana | 0.0 /100 | #317 | Tragic 8.5% |