Indian (Asian) vs Immigrants from Afghanistan Unemployment Among Ages 25 to 29 years

COMPARE

Indian (Asian)
Race
Ancestry
AfghanAfricanAlaska NativeAlaskan AthabascanAlbanianAleutAlsatianAmericanApacheArabArapahoArgentineanArmenianAssyrian/Chaldean/SyriacAustralianAustrianBahamianBangladeshiBarbadianBasqueBelgianBelizeanBermudanBhutaneseBlackfeetBolivianBrazilianBritishBritish West IndianBulgarianBurmeseCajunCambodianCanadianCape VerdeanCarpatho RusynCelticCentral AmericanCentral American IndianCherokeeCheyenneChickasawChileanChineseChippewaChoctawColombianColvilleComancheCosta RicanCreeCreekCroatianCrowCubanCypriotCzechCzechoslovakianDanishDelawareDominicanDutchDutch West IndianEastern EuropeanEcuadorianEgyptianEnglishEstonianEthiopianEuropeanFijianFilipinoFinnishFrenchFrench American IndianFrench CanadianGermanGerman RussianGhanaianGreekGuamanian/ChamorroGuatemalanGuyaneseHaitianHmongHonduranHopiHoumaHungarianIcelanderIndian (Asian)IndonesianInupiatIranianIraqiIrishIroquoisIsraeliItalianJamaicanJapaneseJordanianKenyanKiowaKoreanLaotianLatvianLebaneseLiberianLithuanianLumbeeLuxembourgerMacedonianMalaysianMalteseMarshalleseMenomineeMexicanMexican American IndianMongolianMoroccanNative HawaiianNavajoNepaleseNew ZealanderNicaraguanNigerianNorthern EuropeanNorwegianOkinawanOsageOttawaPaiutePakistaniPalestinianPanamanianParaguayanPennsylvania GermanPeruvianPimaPolishPortuguesePotawatomiPuebloPuerto RicanPuget Sound SalishRomanianRussianSalvadoranSamoanScandinavianScotch-IrishScottishSeminoleSenegaleseSerbianShoshoneSierra LeoneanSiouxSlavicSlovakSloveneSomaliSouth AfricanSouth AmericanSouth American IndianSoviet UnionSpaniardSpanishSpanish AmericanSpanish American IndianSri LankanSubsaharan AfricanSudaneseSwedishSwissSyrianTaiwaneseThaiTlingit-HaidaTohono O'OdhamTonganTrinidadian and TobagonianTsimshianTurkishU.S. Virgin IslanderUgandanUkrainianUruguayanUteVenezuelanVietnameseWelshWest IndianYakamaYaquiYugoslavianYumanYup'ikZimbabwean
Immigration
NonimmigrantsImmigrantsAfricaAlbaniaArgentinaArmeniaAsiaAustraliaAustriaBahamasBangladeshBarbadosBelarusBelgiumBelizeBoliviaBosnia and HerzegovinaBrazilBulgariaBurma/MyanmarCabo VerdeCambodiaCameroonCanadaCaribbeanCentral AmericaChileChinaColombiaCongoCosta RicaCroatiaCubaCzechoslovakiaDenmarkDominicaDominican RepublicEastern AfricaEastern AsiaEastern EuropeEcuadorEgyptEl SalvadorEnglandEritreaEthiopiaEuropeFijiFranceGermanyGhanaGreeceGrenadaGuatemalaGuyanaHaitiHondurasHong KongHungaryIndiaIndonesiaIranIraqIrelandIsraelItalyJamaicaJapanJordanKazakhstanKenyaKoreaKuwaitLaosLatin AmericaLatviaLebanonLiberiaLithuaniaMalaysiaMexicoMicronesiaMiddle AfricaMoldovaMoroccoNepalNetherlandsNicaraguaNigeriaNorth AmericaNorth MacedoniaNorthern AfricaNorthern EuropeNorwayOceaniaPakistanPanamaPeruPhilippinesPolandPortugalRomaniaRussiaSaudi ArabiaScotlandSenegalSerbiaSierra LeoneSingaporeSomaliaSouth AfricaSouth AmericaSouth Central AsiaSouth Eastern AsiaSouthern EuropeSpainSri LankaSt. Vincent and the GrenadinesSudanSwedenSwitzerlandSyriaTaiwanThailandTrinidad and TobagoTurkeyUgandaUkraineUruguayUzbekistanVenezuelaVietnamWest IndiesWestern AfricaWestern AsiaWestern EuropeYemenZaireZimbabweAzores
Immigrants from Afghanistan
Race
Ancestry
AfghanAfricanAlaska NativeAlaskan AthabascanAlbanianAleutAlsatianAmericanApacheArabArapahoArgentineanArmenianAssyrian/Chaldean/SyriacAustralianAustrianBahamianBangladeshiBarbadianBasqueBelgianBelizeanBermudanBhutaneseBlackfeetBolivianBrazilianBritishBritish West IndianBulgarianBurmeseCajunCambodianCanadianCape VerdeanCarpatho RusynCelticCentral AmericanCentral American IndianCherokeeCheyenneChickasawChileanChineseChippewaChoctawColombianColvilleComancheCosta RicanCreeCreekCroatianCrowCubanCypriotCzechCzechoslovakianDanishDelawareDominicanDutchDutch West IndianEastern EuropeanEcuadorianEgyptianEnglishEstonianEthiopianEuropeanFijianFilipinoFinnishFrenchFrench American IndianFrench CanadianGermanGerman RussianGhanaianGreekGuamanian/ChamorroGuatemalanGuyaneseHaitianHmongHonduranHopiHoumaHungarianIcelanderIndonesianInupiatIranianIraqiIrishIroquoisIsraeliItalianJamaicanJapaneseJordanianKenyanKiowaKoreanLaotianLatvianLebaneseLiberianLithuanianLumbeeLuxembourgerMacedonianMalaysianMalteseMarshalleseMenomineeMexicanMexican American IndianMongolianMoroccanNative HawaiianNavajoNepaleseNew ZealanderNicaraguanNigerianNorthern EuropeanNorwegianOkinawanOsageOttawaPaiutePakistaniPalestinianPanamanianParaguayanPennsylvania GermanPeruvianPimaPolishPortuguesePotawatomiPuebloPuerto RicanPuget Sound SalishRomanianRussianSalvadoranSamoanScandinavianScotch-IrishScottishSeminoleSenegaleseSerbianShoshoneSierra LeoneanSiouxSlavicSlovakSloveneSomaliSouth AfricanSouth AmericanSouth American IndianSoviet UnionSpaniardSpanishSpanish AmericanSpanish American IndianSri LankanSubsaharan AfricanSudaneseSwedishSwissSyrianTaiwaneseThaiTlingit-HaidaTohono O'OdhamTonganTrinidadian and TobagonianTsimshianTurkishU.S. Virgin IslanderUgandanUkrainianUruguayanUteVenezuelanVietnameseWelshWest IndianYakamaYaquiYugoslavianYumanYup'ikZimbabwean
Immigration
NonimmigrantsImmigrantsAfghanistanAfricaAlbaniaArgentinaArmeniaAsiaAustraliaAustriaBahamasBangladeshBarbadosBelarusBelgiumBelizeBoliviaBosnia and HerzegovinaBrazilBulgariaBurma/MyanmarCabo VerdeCambodiaCameroonCanadaCaribbeanCentral AmericaChileChinaColombiaCongoCosta RicaCroatiaCubaCzechoslovakiaDenmarkDominicaDominican RepublicEastern AfricaEastern AsiaEastern EuropeEcuadorEgyptEl SalvadorEnglandEritreaEthiopiaEuropeFijiFranceGermanyGhanaGreeceGrenadaGuatemalaGuyanaHaitiHondurasHong KongHungaryIndiaIndonesiaIranIraqIrelandIsraelItalyJamaicaJapanJordanKazakhstanKenyaKoreaKuwaitLaosLatin AmericaLatviaLebanonLiberiaLithuaniaMalaysiaMexicoMicronesiaMiddle AfricaMoldovaMoroccoNepalNetherlandsNicaraguaNigeriaNorth AmericaNorth MacedoniaNorthern AfricaNorthern EuropeNorwayOceaniaPakistanPanamaPeruPhilippinesPolandPortugalRomaniaRussiaSaudi ArabiaScotlandSenegalSerbiaSierra LeoneSingaporeSomaliaSouth AfricaSouth AmericaSouth Central AsiaSouth Eastern AsiaSouthern EuropeSpainSri LankaSt. Vincent and the GrenadinesSudanSwedenSwitzerlandSyriaTaiwanThailandTrinidad and TobagoTurkeyUgandaUkraineUruguayUzbekistanVenezuelaVietnamWest IndiesWestern AfricaWestern AsiaWestern EuropeYemenZaireZimbabweAzores
Unemployment Among Ages 25 to 29 years
Income
Poverty
Unemployment
Labor Participation
Family Structure
Vehicle Availability
Education Level
Disability

Unemployment Among Ages 25 to 29 years Comparison

Indians (Asian)

Immigrants from Afghanistan

Exceptional
Good
6.3%
UNEMPLOYMENT AMONG AGES 25 TO 29 YEARS
97.8/ 100
METRIC RATING
66th/ 347
METRIC RANK
6.5%
UNEMPLOYMENT AMONG AGES 25 TO 29 YEARS
79.2/ 100
METRIC RATING
131st/ 347
METRIC RANK

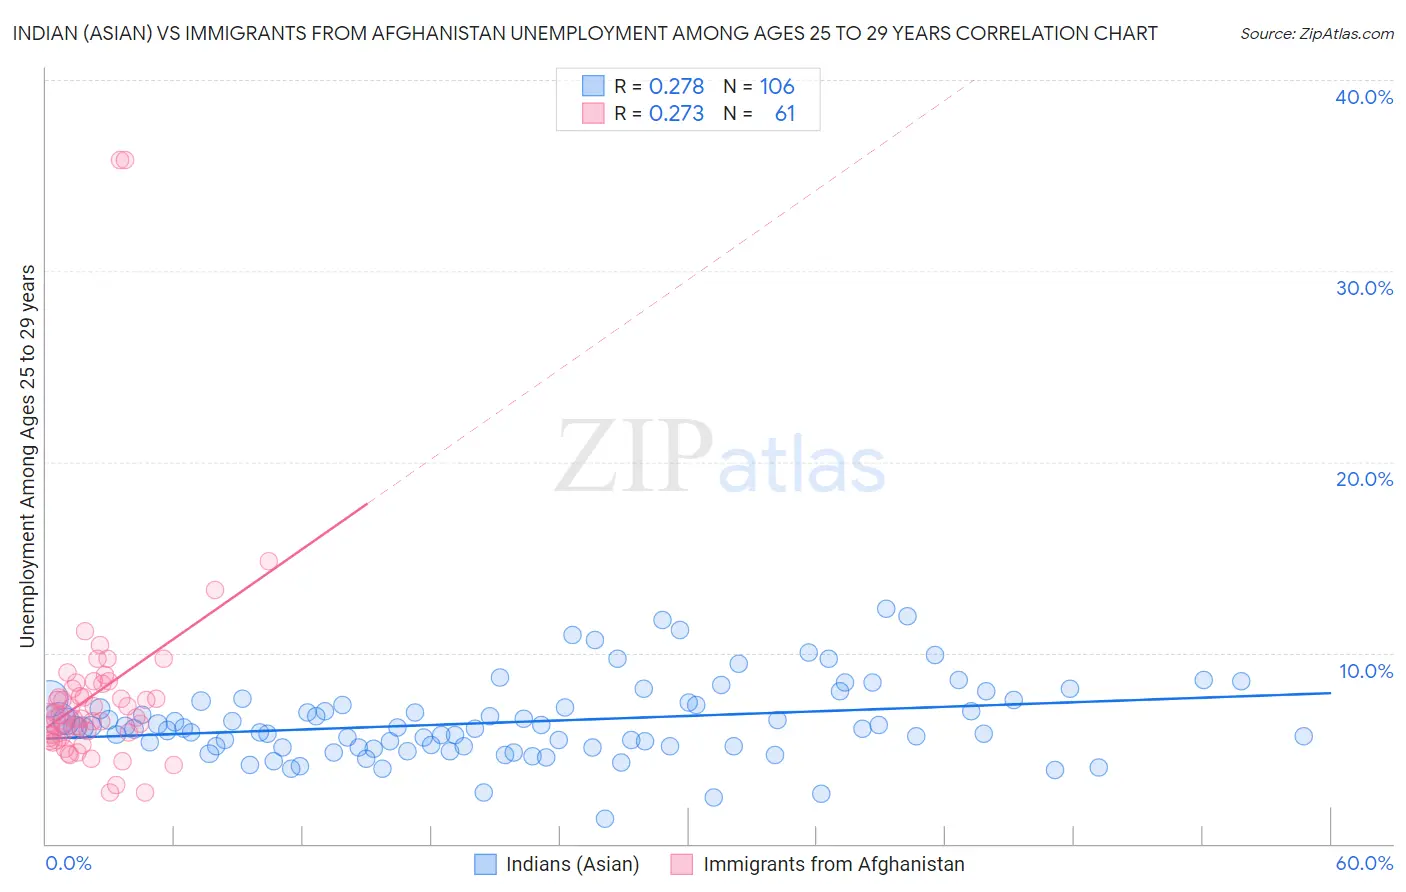
Indian (Asian) vs Immigrants from Afghanistan Unemployment Among Ages 25 to 29 years Correlation Chart

The statistical analysis conducted on geographies consisting of 460,677,018 people shows a weak positive correlation between the proportion of Indians (Asian) and unemployment rate among population between the ages 25 and 29 in the United States with a correlation coefficient (R) of 0.278 and weighted average of 6.3%. Similarly, the statistical analysis conducted on geographies consisting of 146,183,722 people shows a weak positive correlation between the proportion of Immigrants from Afghanistan and unemployment rate among population between the ages 25 and 29 in the United States with a correlation coefficient (R) of 0.273 and weighted average of 6.5%, a difference of 4.0%.
Indian (Asian) vs Immigrants from Afghanistan Unemployment Among Ages 25 to 29 years

Unemployment Among Ages 25 to 29 years Correlation Summary

MeasurementIndian (Asian)Immigrants from Afghanistan
Minimum1.3%2.7%
Maximum12.3%35.8%
Range11.0%33.1%
Mean6.4%7.9%
Median6.1%6.6%
Interquartile 25% (IQ1)5.1%5.6%
Interquartile 75% (IQ3)7.4%8.2%
Interquartile Range (IQR)2.3%2.7%
Standard Deviation (Sample)2.0%5.6%
Standard Deviation (Population)2.0%5.6%

Similar Demographics by Unemployment Among Ages 25 to 29 years

Demographics Similar to Indians (Asian) by Unemployment Among Ages 25 to 29 years

In terms of unemployment among ages 25 to 29 years, the demographic groups most similar to Indians (Asian) are Immigrants from Northern Africa (6.3%, a difference of 0.010%), Immigrants from Lebanon (6.3%, a difference of 0.020%), Palestinian (6.3%, a difference of 0.050%), Immigrants from Sri Lanka (6.3%, a difference of 0.070%), and Kenyan (6.3%, a difference of 0.12%).
DemographicsRating | RankUnemployment Among Ages 25 to 29 years
Luxembourgers
98.3
/100
|
#59
Exceptional
6.2%
Immigrants | Taiwan
98.3
/100
|
#60
Exceptional
6.2%
Bhutanese
98.2
/100
|
#61
Exceptional
6.2%
Immigrants | China
98.1
/100
|
#62
Exceptional
6.2%
Kenyans
98.0
/100
|
#63
Exceptional
6.3%
Immigrants | Sri Lanka
97.9
/100
|
#64
Exceptional
6.3%
Immigrants | Lebanon
97.8
/100
|
#65
Exceptional
6.3%
Indians (Asian)
97.8
/100
|
#66
Exceptional
6.3%
Immigrants | Northern Africa
97.8
/100
|
#67
Exceptional
6.3%
Palestinians
97.7
/100
|
#68
Exceptional
6.3%
Immigrants | Hong Kong
97.5
/100
|
#69
Exceptional
6.3%
Immigrants | Malaysia
97.5
/100
|
#70
Exceptional
6.3%
Immigrants | France
97.4
/100
|
#71
Exceptional
6.3%
Scandinavians
97.4
/100
|
#72
Exceptional
6.3%
Belgians
97.0
/100
|
#73
Exceptional
6.3%

Demographics Similar to Immigrants from Afghanistan by Unemployment Among Ages 25 to 29 years

In terms of unemployment among ages 25 to 29 years, the demographic groups most similar to Immigrants from Afghanistan are Immigrants from Peru (6.5%, a difference of 0.070%), Sri Lankan (6.5%, a difference of 0.11%), Immigrants from Chile (6.5%, a difference of 0.13%), Dutch (6.5%, a difference of 0.14%), and Polish (6.5%, a difference of 0.23%).
DemographicsRating | RankUnemployment Among Ages 25 to 29 years
Arabs
82.5
/100
|
#124
Excellent
6.5%
Syrians
82.1
/100
|
#125
Excellent
6.5%
Brazilians
81.9
/100
|
#126
Excellent
6.5%
Dutch
80.6
/100
|
#127
Excellent
6.5%
Immigrants | Chile
80.5
/100
|
#128
Excellent
6.5%
Sri Lankans
80.3
/100
|
#129
Excellent
6.5%
Immigrants | Peru
79.9
/100
|
#130
Good
6.5%
Immigrants | Afghanistan
79.2
/100
|
#131
Good
6.5%
Poles
76.6
/100
|
#132
Good
6.5%
Immigrants | Europe
75.7
/100
|
#133
Good
6.5%
Immigrants | Vietnam
75.6
/100
|
#134
Good
6.5%
Immigrants | Croatia
75.5
/100
|
#135
Good
6.5%
Northern Europeans
75.4
/100
|
#136
Good
6.5%
Eastern Europeans
74.1
/100
|
#137
Good
6.5%
Immigrants | Belgium
73.8
/100
|
#138
Good
6.5%