Vietnamese vs Chinese Unemployment Among Ages 20 to 24 years
COMPARE
Vietnamese
Chinese
Unemployment Among Ages 20 to 24 years
Unemployment Among Ages 20 to 24 years Comparison
Vietnamese
Chinese
12.6%
UNEMPLOYMENT AMONG AGES 20 TO 24 YEARS
0.0/ 100
METRIC RATING
311th/ 347
METRIC RANK
9.4%
UNEMPLOYMENT AMONG AGES 20 TO 24 YEARS
100.0/ 100
METRIC RATING
18th/ 347
METRIC RANK
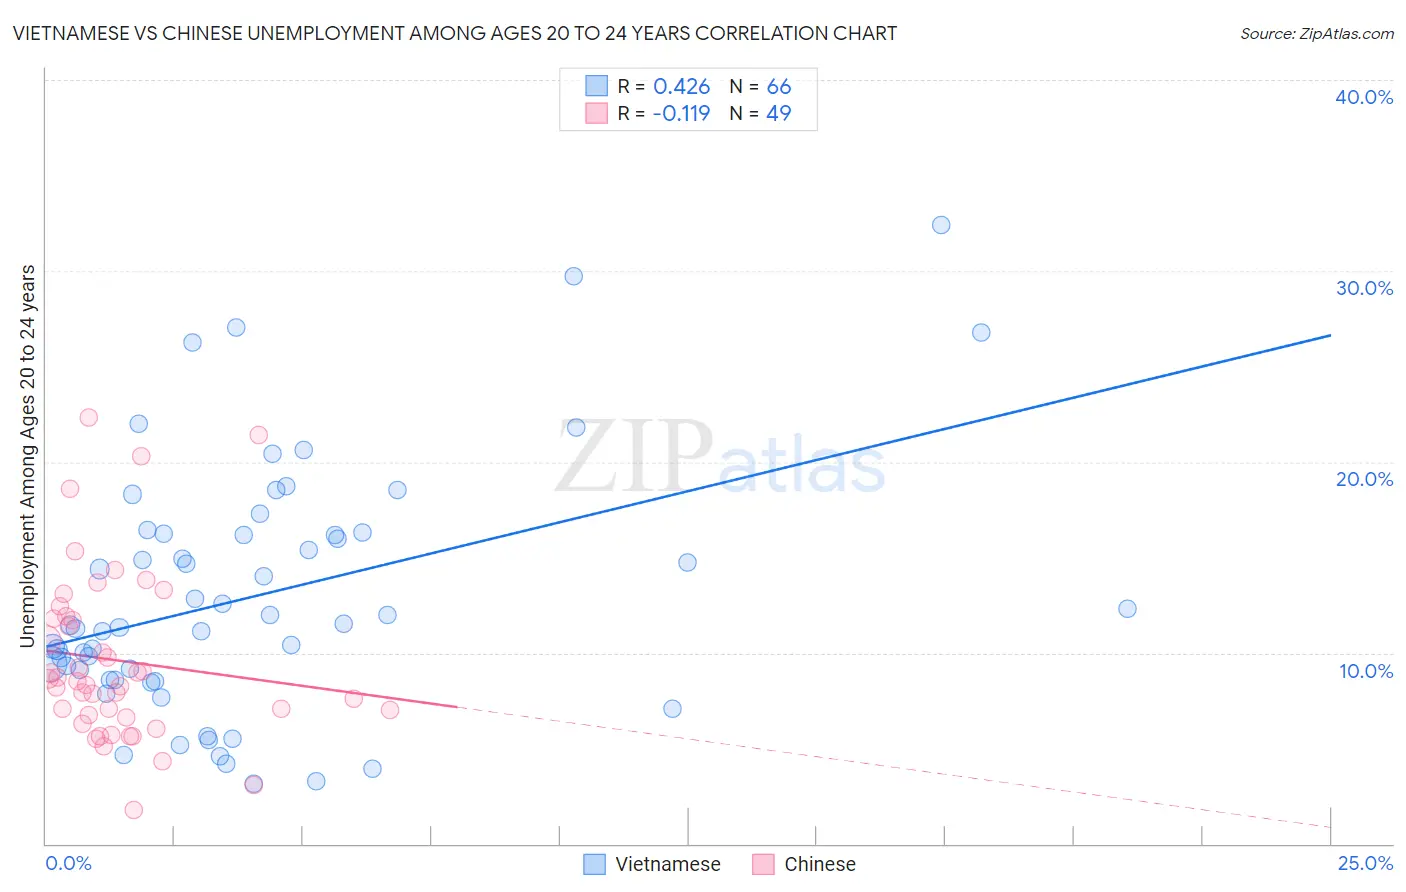
Vietnamese vs Chinese Unemployment Among Ages 20 to 24 years Correlation Chart
The statistical analysis conducted on geographies consisting of 169,456,792 people shows a moderate positive correlation between the proportion of Vietnamese and unemployment rate among population between the ages 20 and 24 in the United States with a correlation coefficient (R) of 0.426 and weighted average of 12.6%. Similarly, the statistical analysis conducted on geographies consisting of 64,258,935 people shows a poor negative correlation between the proportion of Chinese and unemployment rate among population between the ages 20 and 24 in the United States with a correlation coefficient (R) of -0.119 and weighted average of 9.4%, a difference of 34.7%.
Unemployment Among Ages 20 to 24 years Correlation Summary
| Measurement | Vietnamese | Chinese |
| Minimum | 3.1% | 1.8% |
| Maximum | 32.4% | 22.3% |
| Range | 29.3% | 20.5% |
| Mean | 13.0% | 9.6% |
| Median | 11.5% | 8.5% |
| Interquartile 25% (IQ1) | 8.6% | 6.7% |
| Interquartile 75% (IQ3) | 16.3% | 11.8% |
| Interquartile Range (IQR) | 7.7% | 5.2% |
| Standard Deviation (Sample) | 6.5% | 4.5% |
| Standard Deviation (Population) | 6.4% | 4.4% |
Similar Demographics by Unemployment Among Ages 20 to 24 years
Demographics Similar to Vietnamese by Unemployment Among Ages 20 to 24 years
In terms of unemployment among ages 20 to 24 years, the demographic groups most similar to Vietnamese are Houma (12.6%, a difference of 0.15%), Jamaican (12.6%, a difference of 0.44%), Immigrants from Bangladesh (12.6%, a difference of 0.57%), Tohono O'odham (12.5%, a difference of 0.64%), and Shoshone (12.7%, a difference of 0.69%).
| Demographics | Rating | Rank | Unemployment Among Ages 20 to 24 years |
| Immigrants | West Indies | 0.0 /100 | #304 | Tragic 12.3% |
| Chippewa | 0.0 /100 | #305 | Tragic 12.3% |
| Immigrants | Haiti | 0.0 /100 | #306 | Tragic 12.4% |
| Bermudans | 0.0 /100 | #307 | Tragic 12.5% |
| Tohono O'odham | 0.0 /100 | #308 | Tragic 12.5% |
| Immigrants | Bangladesh | 0.0 /100 | #309 | Tragic 12.6% |
| Jamaicans | 0.0 /100 | #310 | Tragic 12.6% |
| Vietnamese | 0.0 /100 | #311 | Tragic 12.6% |
| Houma | 0.0 /100 | #312 | Tragic 12.6% |
| Shoshone | 0.0 /100 | #313 | Tragic 12.7% |
| Blacks/African Americans | 0.0 /100 | #314 | Tragic 12.7% |
| West Indians | 0.0 /100 | #315 | Tragic 12.8% |
| Immigrants | Dominica | 0.0 /100 | #316 | Tragic 12.8% |
| Immigrants | Trinidad and Tobago | 0.0 /100 | #317 | Tragic 12.8% |
| Barbadians | 0.0 /100 | #318 | Tragic 12.9% |
Demographics Similar to Chinese by Unemployment Among Ages 20 to 24 years
In terms of unemployment among ages 20 to 24 years, the demographic groups most similar to Chinese are Hmong (9.4%, a difference of 0.12%), Osage (9.4%, a difference of 0.13%), Immigrants from Bosnia and Herzegovina (9.4%, a difference of 0.13%), Tongan (9.4%, a difference of 0.40%), and Immigrants from Nepal (9.4%, a difference of 0.41%).
| Demographics | Rating | Rank | Unemployment Among Ages 20 to 24 years |
| Zimbabweans | 100.0 /100 | #11 | Exceptional 9.2% |
| Cubans | 100.0 /100 | #12 | Exceptional 9.2% |
| Immigrants | Congo | 100.0 /100 | #13 | Exceptional 9.2% |
| Slovenes | 100.0 /100 | #14 | Exceptional 9.3% |
| Immigrants | Sudan | 100.0 /100 | #15 | Exceptional 9.3% |
| Danes | 100.0 /100 | #16 | Exceptional 9.3% |
| Czechs | 100.0 /100 | #17 | Exceptional 9.3% |
| Chinese | 100.0 /100 | #18 | Exceptional 9.4% |
| Hmong | 100.0 /100 | #19 | Exceptional 9.4% |
| Osage | 100.0 /100 | #20 | Exceptional 9.4% |
| Immigrants | Bosnia and Herzegovina | 100.0 /100 | #21 | Exceptional 9.4% |
| Tongans | 100.0 /100 | #22 | Exceptional 9.4% |
| Immigrants | Nepal | 100.0 /100 | #23 | Exceptional 9.4% |
| Taiwanese | 100.0 /100 | #24 | Exceptional 9.4% |
| Immigrants | Eritrea | 100.0 /100 | #25 | Exceptional 9.5% |