Vietnamese vs Eastern European Unemployment Among Ages 20 to 24 years
COMPARE
Vietnamese
Eastern European
Unemployment Among Ages 20 to 24 years
Unemployment Among Ages 20 to 24 years Comparison
Vietnamese
Eastern Europeans
12.6%
UNEMPLOYMENT AMONG AGES 20 TO 24 YEARS
0.0/ 100
METRIC RATING
311th/ 347
METRIC RANK
10.6%
UNEMPLOYMENT AMONG AGES 20 TO 24 YEARS
6.9/ 100
METRIC RATING
220th/ 347
METRIC RANK
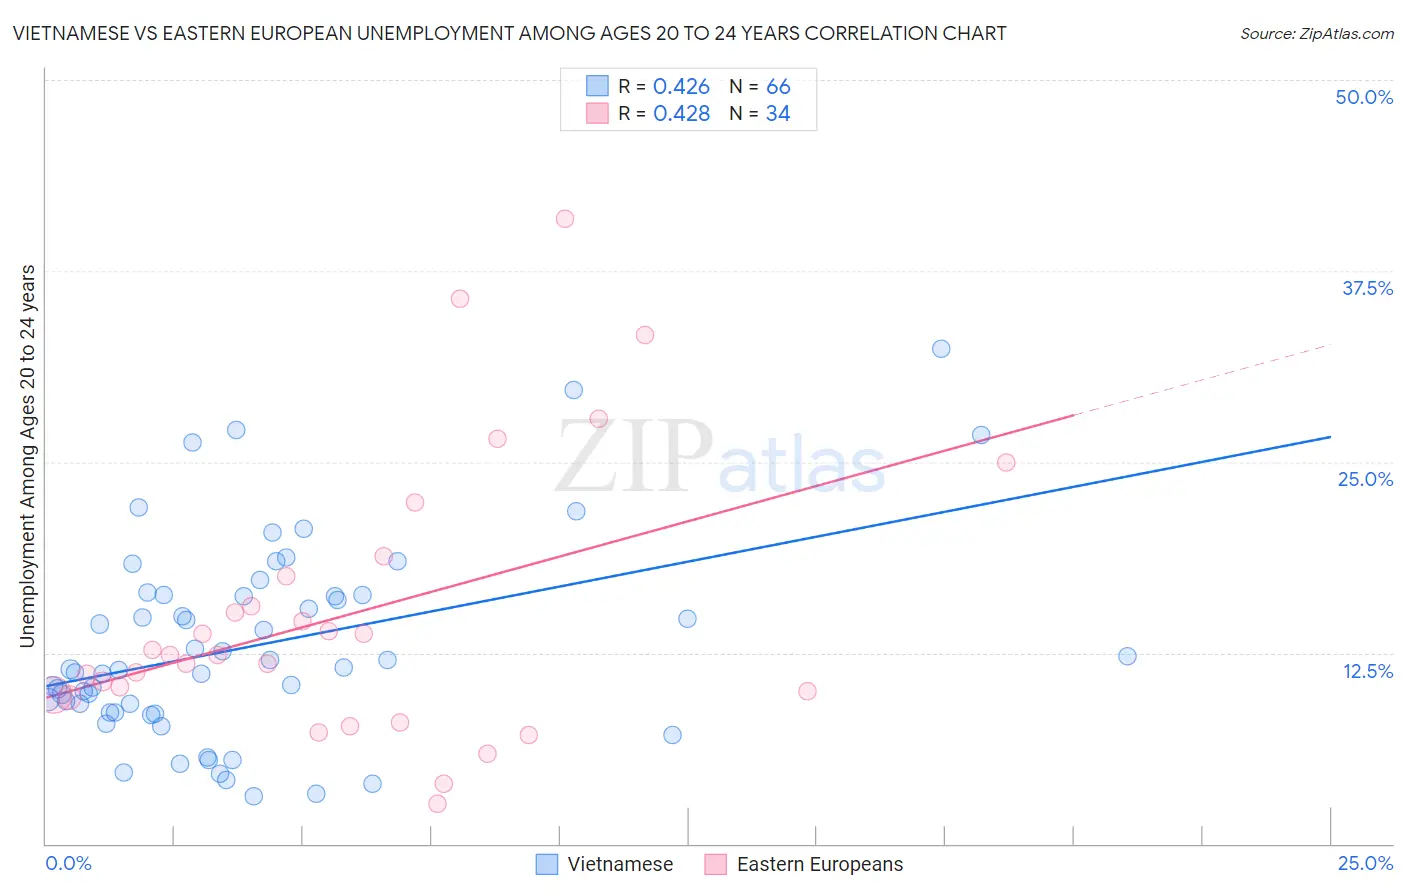
Vietnamese vs Eastern European Unemployment Among Ages 20 to 24 years Correlation Chart
The statistical analysis conducted on geographies consisting of 169,456,792 people shows a moderate positive correlation between the proportion of Vietnamese and unemployment rate among population between the ages 20 and 24 in the United States with a correlation coefficient (R) of 0.426 and weighted average of 12.6%. Similarly, the statistical analysis conducted on geographies consisting of 438,845,998 people shows a moderate positive correlation between the proportion of Eastern Europeans and unemployment rate among population between the ages 20 and 24 in the United States with a correlation coefficient (R) of 0.428 and weighted average of 10.6%, a difference of 19.6%.
Unemployment Among Ages 20 to 24 years Correlation Summary
| Measurement | Vietnamese | Eastern European |
| Minimum | 3.1% | 2.6% |
| Maximum | 32.4% | 40.9% |
| Range | 29.3% | 38.3% |
| Mean | 13.0% | 15.0% |
| Median | 11.5% | 12.4% |
| Interquartile 25% (IQ1) | 8.6% | 9.7% |
| Interquartile 75% (IQ3) | 16.3% | 17.5% |
| Interquartile Range (IQR) | 7.7% | 7.8% |
| Standard Deviation (Sample) | 6.5% | 9.0% |
| Standard Deviation (Population) | 6.4% | 8.9% |
Similar Demographics by Unemployment Among Ages 20 to 24 years
Demographics Similar to Vietnamese by Unemployment Among Ages 20 to 24 years
In terms of unemployment among ages 20 to 24 years, the demographic groups most similar to Vietnamese are Houma (12.6%, a difference of 0.15%), Jamaican (12.6%, a difference of 0.44%), Immigrants from Bangladesh (12.6%, a difference of 0.57%), Tohono O'odham (12.5%, a difference of 0.64%), and Shoshone (12.7%, a difference of 0.69%).
| Demographics | Rating | Rank | Unemployment Among Ages 20 to 24 years |
| Immigrants | West Indies | 0.0 /100 | #304 | Tragic 12.3% |
| Chippewa | 0.0 /100 | #305 | Tragic 12.3% |
| Immigrants | Haiti | 0.0 /100 | #306 | Tragic 12.4% |
| Bermudans | 0.0 /100 | #307 | Tragic 12.5% |
| Tohono O'odham | 0.0 /100 | #308 | Tragic 12.5% |
| Immigrants | Bangladesh | 0.0 /100 | #309 | Tragic 12.6% |
| Jamaicans | 0.0 /100 | #310 | Tragic 12.6% |
| Vietnamese | 0.0 /100 | #311 | Tragic 12.6% |
| Houma | 0.0 /100 | #312 | Tragic 12.6% |
| Shoshone | 0.0 /100 | #313 | Tragic 12.7% |
| Blacks/African Americans | 0.0 /100 | #314 | Tragic 12.7% |
| West Indians | 0.0 /100 | #315 | Tragic 12.8% |
| Immigrants | Dominica | 0.0 /100 | #316 | Tragic 12.8% |
| Immigrants | Trinidad and Tobago | 0.0 /100 | #317 | Tragic 12.8% |
| Barbadians | 0.0 /100 | #318 | Tragic 12.9% |
Demographics Similar to Eastern Europeans by Unemployment Among Ages 20 to 24 years
In terms of unemployment among ages 20 to 24 years, the demographic groups most similar to Eastern Europeans are Central American (10.6%, a difference of 0.010%), Immigrants from Poland (10.6%, a difference of 0.070%), Immigrants from Southern Europe (10.5%, a difference of 0.14%), Arab (10.6%, a difference of 0.19%), and Nonimmigrants (10.5%, a difference of 0.24%).
| Demographics | Rating | Rank | Unemployment Among Ages 20 to 24 years |
| Guatemalans | 12.2 /100 | #213 | Poor 10.5% |
| Kiowa | 11.7 /100 | #214 | Poor 10.5% |
| Hondurans | 10.5 /100 | #215 | Poor 10.5% |
| Costa Ricans | 9.6 /100 | #216 | Tragic 10.5% |
| Cherokee | 9.3 /100 | #217 | Tragic 10.5% |
| Immigrants | Nonimmigrants | 8.8 /100 | #218 | Tragic 10.5% |
| Immigrants | Southern Europe | 8.0 /100 | #219 | Tragic 10.5% |
| Eastern Europeans | 6.9 /100 | #220 | Tragic 10.6% |
| Central Americans | 6.8 /100 | #221 | Tragic 10.6% |
| Immigrants | Poland | 6.4 /100 | #222 | Tragic 10.6% |
| Arabs | 5.6 /100 | #223 | Tragic 10.6% |
| Nepalese | 5.1 /100 | #224 | Tragic 10.6% |
| Immigrants | South America | 5.1 /100 | #225 | Tragic 10.6% |
| Immigrants | Costa Rica | 4.9 /100 | #226 | Tragic 10.6% |
| Palestinians | 4.9 /100 | #227 | Tragic 10.6% |