Immigrants from South Central Asia vs Iraqi Unemployment Among Ages 20 to 24 years

COMPARE

Immigrants from South Central Asia
Race
Ancestry
AfghanAfricanAlaska NativeAlaskan AthabascanAlbanianAleutAlsatianAmericanApacheArabArapahoArgentineanArmenianAssyrian/Chaldean/SyriacAustralianAustrianBahamianBangladeshiBarbadianBasqueBelgianBelizeanBermudanBhutaneseBlackfeetBolivianBrazilianBritishBritish West IndianBulgarianBurmeseCajunCambodianCanadianCape VerdeanCarpatho RusynCelticCentral AmericanCentral American IndianCherokeeCheyenneChickasawChileanChineseChippewaChoctawColombianColvilleComancheCosta RicanCreeCreekCroatianCrowCubanCypriotCzechCzechoslovakianDanishDelawareDominicanDutchDutch West IndianEastern EuropeanEcuadorianEgyptianEnglishEstonianEthiopianEuropeanFijianFilipinoFinnishFrenchFrench American IndianFrench CanadianGermanGerman RussianGhanaianGreekGuamanian/ChamorroGuatemalanGuyaneseHaitianHmongHonduranHopiHoumaHungarianIcelanderIndian (Asian)IndonesianInupiatIranianIrishIroquoisIsraeliItalianJamaicanJapaneseJordanianKenyanKiowaKoreanLaotianLatvianLebaneseLiberianLithuanianLumbeeLuxembourgerMacedonianMalaysianMalteseMarshalleseMenomineeMexicanMexican American IndianMongolianMoroccanNative HawaiianNavajoNepaleseNew ZealanderNicaraguanNigerianNorthern EuropeanNorwegianOkinawanOsageOttawaPaiutePakistaniPalestinianPanamanianParaguayanPennsylvania GermanPeruvianPimaPolishPortuguesePotawatomiPuebloPuerto RicanPuget Sound SalishRomanianRussianSalvadoranSamoanScandinavianScotch-IrishScottishSeminoleSenegaleseSerbianShoshoneSierra LeoneanSiouxSlavicSlovakSloveneSomaliSouth AfricanSouth AmericanSouth American IndianSoviet UnionSpaniardSpanishSpanish AmericanSpanish American IndianSri LankanSubsaharan AfricanSudaneseSwedishSwissSyrianTaiwaneseThaiTlingit-HaidaTohono O'OdhamTonganTrinidadian and TobagonianTsimshianTurkishU.S. Virgin IslanderUgandanUkrainianUruguayanUteVenezuelanVietnameseWelshWest IndianYakamaYaquiYugoslavianYumanYup'ikZimbabwean
Immigration
NonimmigrantsImmigrantsAfghanistanAfricaAlbaniaArgentinaArmeniaAsiaAustraliaAustriaBahamasBangladeshBarbadosBelarusBelgiumBelizeBoliviaBosnia and HerzegovinaBrazilBulgariaBurma/MyanmarCabo VerdeCambodiaCameroonCanadaCaribbeanCentral AmericaChileChinaColombiaCongoCosta RicaCroatiaCubaCzechoslovakiaDenmarkDominicaDominican RepublicEastern AfricaEastern AsiaEastern EuropeEcuadorEgyptEl SalvadorEnglandEritreaEthiopiaEuropeFijiFranceGermanyGhanaGreeceGrenadaGuatemalaGuyanaHaitiHondurasHong KongHungaryIndiaIndonesiaIranIraqIrelandIsraelItalyJamaicaJapanJordanKazakhstanKenyaKoreaKuwaitLaosLatin AmericaLatviaLebanonLiberiaLithuaniaMalaysiaMexicoMicronesiaMiddle AfricaMoldovaMoroccoNepalNetherlandsNicaraguaNigeriaNorth AmericaNorth MacedoniaNorthern AfricaNorthern EuropeNorwayOceaniaPakistanPanamaPeruPhilippinesPolandPortugalRomaniaRussiaSaudi ArabiaScotlandSenegalSerbiaSierra LeoneSingaporeSomaliaSouth AfricaSouth AmericaSouth Central AsiaSouth Eastern AsiaSouthern EuropeSpainSri LankaSt. Vincent and the GrenadinesSudanSwedenSwitzerlandSyriaTaiwanThailandTrinidad and TobagoTurkeyUgandaUkraineUruguayUzbekistanVenezuelaVietnamWest IndiesWestern AfricaWestern AsiaWestern EuropeYemenZaireZimbabweAzores
Iraqi
Race
Ancestry
AfghanAfricanAlaska NativeAlaskan AthabascanAlbanianAleutAlsatianAmericanApacheArabArapahoArgentineanArmenianAssyrian/Chaldean/SyriacAustralianAustrianBahamianBangladeshiBarbadianBasqueBelgianBelizeanBermudanBhutaneseBlackfeetBolivianBrazilianBritishBritish West IndianBulgarianBurmeseCajunCambodianCanadianCape VerdeanCarpatho RusynCelticCentral AmericanCentral American IndianCherokeeCheyenneChickasawChileanChineseChippewaChoctawColombianColvilleComancheCosta RicanCreeCreekCroatianCrowCubanCypriotCzechCzechoslovakianDanishDelawareDominicanDutchDutch West IndianEastern EuropeanEcuadorianEgyptianEnglishEstonianEthiopianEuropeanFijianFilipinoFinnishFrenchFrench American IndianFrench CanadianGermanGerman RussianGhanaianGreekGuamanian/ChamorroGuatemalanGuyaneseHaitianHmongHonduranHopiHoumaHungarianIcelanderIndian (Asian)IndonesianInupiatIranianIraqiIrishIroquoisIsraeliItalianJamaicanJapaneseJordanianKenyanKiowaKoreanLaotianLatvianLebaneseLiberianLithuanianLumbeeLuxembourgerMacedonianMalaysianMalteseMarshalleseMenomineeMexicanMexican American IndianMongolianMoroccanNative HawaiianNavajoNepaleseNew ZealanderNicaraguanNigerianNorthern EuropeanNorwegianOkinawanOsageOttawaPaiutePakistaniPalestinianPanamanianParaguayanPennsylvania GermanPeruvianPimaPolishPortuguesePotawatomiPuebloPuerto RicanPuget Sound SalishRomanianRussianSalvadoranSamoanScandinavianScotch-IrishScottishSeminoleSenegaleseSerbianShoshoneSierra LeoneanSiouxSlavicSlovakSloveneSomaliSouth AfricanSouth AmericanSouth American IndianSoviet UnionSpaniardSpanishSpanish AmericanSpanish American IndianSri LankanSubsaharan AfricanSudaneseSwedishSwissSyrianTaiwaneseThaiTlingit-HaidaTohono O'OdhamTonganTrinidadian and TobagonianTsimshianTurkishU.S. Virgin IslanderUgandanUkrainianUruguayanUteVenezuelanVietnameseWelshWest IndianYakamaYaquiYugoslavianYumanYup'ikZimbabwean
Immigration
NonimmigrantsImmigrantsAfghanistanAfricaAlbaniaArgentinaArmeniaAsiaAustraliaAustriaBahamasBangladeshBarbadosBelarusBelgiumBelizeBoliviaBosnia and HerzegovinaBrazilBulgariaBurma/MyanmarCabo VerdeCambodiaCameroonCanadaCaribbeanCentral AmericaChileChinaColombiaCongoCosta RicaCroatiaCubaCzechoslovakiaDenmarkDominicaDominican RepublicEastern AfricaEastern AsiaEastern EuropeEcuadorEgyptEl SalvadorEnglandEritreaEthiopiaEuropeFijiFranceGermanyGhanaGreeceGrenadaGuatemalaGuyanaHaitiHondurasHong KongHungaryIndiaIndonesiaIranIraqIrelandIsraelItalyJamaicaJapanJordanKazakhstanKenyaKoreaKuwaitLaosLatin AmericaLatviaLebanonLiberiaLithuaniaMalaysiaMexicoMicronesiaMiddle AfricaMoldovaMoroccoNepalNetherlandsNicaraguaNigeriaNorth AmericaNorth MacedoniaNorthern AfricaNorthern EuropeNorwayOceaniaPakistanPanamaPeruPhilippinesPolandPortugalRomaniaRussiaSaudi ArabiaScotlandSenegalSerbiaSierra LeoneSingaporeSomaliaSouth AfricaSouth AmericaSouth Eastern AsiaSouthern EuropeSpainSri LankaSt. Vincent and the GrenadinesSudanSwedenSwitzerlandSyriaTaiwanThailandTrinidad and TobagoTurkeyUgandaUkraineUruguayUzbekistanVenezuelaVietnamWest IndiesWestern AfricaWestern AsiaWestern EuropeYemenZaireZimbabweAzores
Unemployment Among Ages 20 to 24 years
Income
Poverty
Unemployment
Labor Participation
Family Structure
Vehicle Availability
Education Level
Disability

Unemployment Among Ages 20 to 24 years Comparison

Immigrants from South Central Asia

Iraqis

Excellent
Average
10.1%
UNEMPLOYMENT AMONG AGES 20 TO 24 YEARS
84.6/ 100
METRIC RATING
129th/ 347
METRIC RANK
10.3%
UNEMPLOYMENT AMONG AGES 20 TO 24 YEARS
56.7/ 100
METRIC RATING
168th/ 347
METRIC RANK

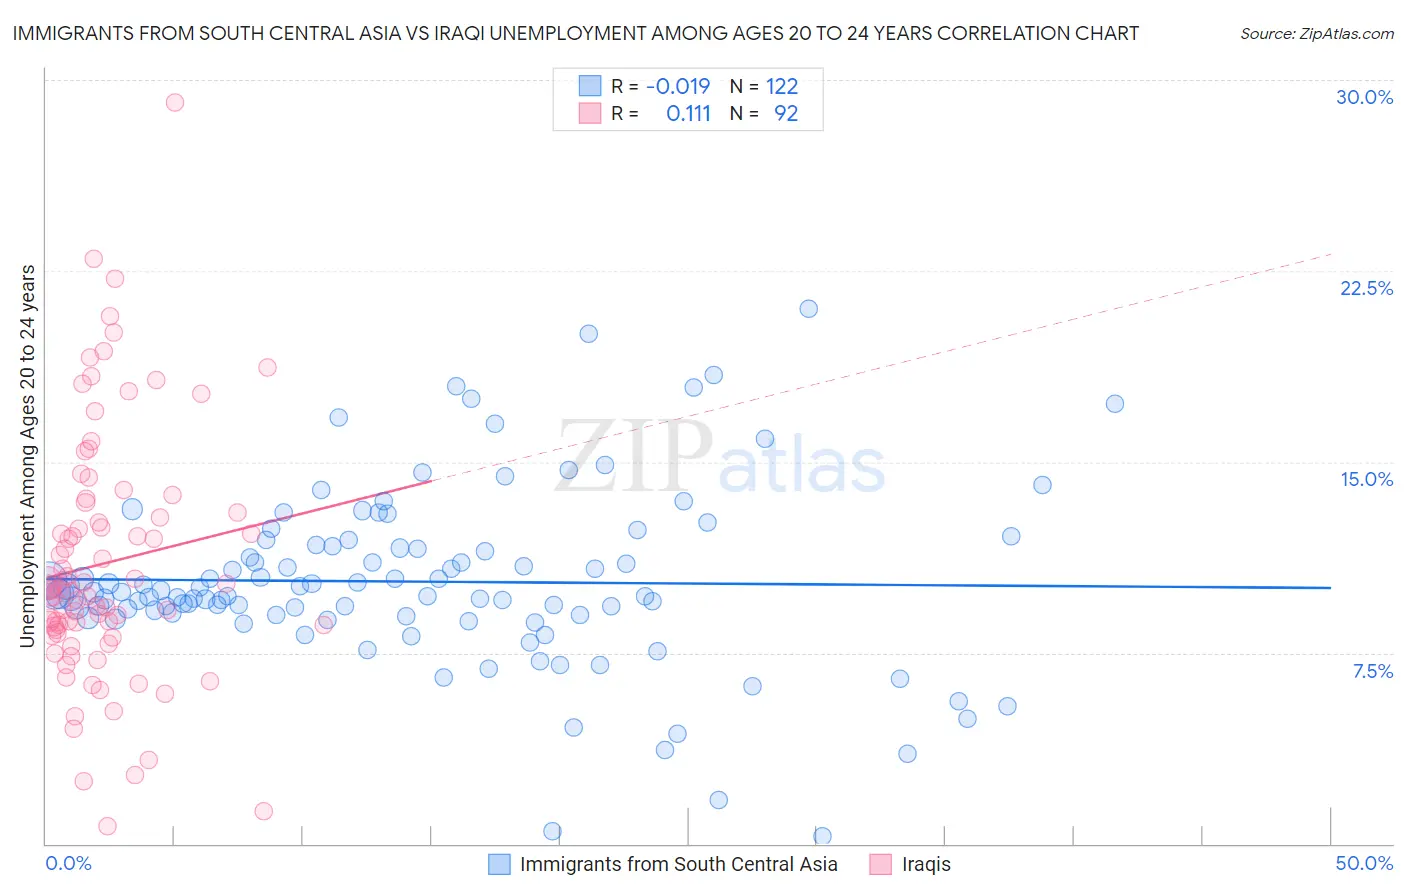
Immigrants from South Central Asia vs Iraqi Unemployment Among Ages 20 to 24 years Correlation Chart

The statistical analysis conducted on geographies consisting of 454,671,108 people shows no correlation between the proportion of Immigrants from South Central Asia and unemployment rate among population between the ages 20 and 24 in the United States with a correlation coefficient (R) of -0.019 and weighted average of 10.1%. Similarly, the statistical analysis conducted on geographies consisting of 168,962,503 people shows a poor positive correlation between the proportion of Iraqis and unemployment rate among population between the ages 20 and 24 in the United States with a correlation coefficient (R) of 0.111 and weighted average of 10.3%, a difference of 1.3%.
Immigrants from South Central Asia vs Iraqi Unemployment Among Ages 20 to 24 years

Unemployment Among Ages 20 to 24 years Correlation Summary

MeasurementImmigrants from South Central AsiaIraqi
Minimum0.30%0.70%
Maximum21.0%29.1%
Range20.7%28.4%
Mean10.3%11.0%
Median9.8%10.0%
Interquartile 25% (IQ1)9.0%8.3%
Interquartile 75% (IQ3)11.7%13.2%
Interquartile Range (IQR)2.7%4.9%
Standard Deviation (Sample)3.5%4.9%
Standard Deviation (Population)3.5%4.9%

Similar Demographics by Unemployment Among Ages 20 to 24 years

Demographics Similar to Immigrants from South Central Asia by Unemployment Among Ages 20 to 24 years

In terms of unemployment among ages 20 to 24 years, the demographic groups most similar to Immigrants from South Central Asia are Immigrants from Brazil (10.1%, a difference of 0.020%), Immigrants from Lithuania (10.1%, a difference of 0.030%), Seminole (10.1%, a difference of 0.030%), Immigrants from South Eastern Asia (10.1%, a difference of 0.040%), and Immigrants from Norway (10.1%, a difference of 0.050%).
DemographicsRating | RankUnemployment Among Ages 20 to 24 years
Whites/Caucasians
87.4
/100
|
#122
Excellent
10.1%
Immigrants | Iraq
87.1
/100
|
#123
Excellent
10.1%
Immigrants | Japan
86.5
/100
|
#124
Excellent
10.1%
Spanish
86.1
/100
|
#125
Excellent
10.1%
Jordanians
86.1
/100
|
#126
Excellent
10.1%
Immigrants | Norway
85.3
/100
|
#127
Excellent
10.1%
Immigrants | Brazil
84.9
/100
|
#128
Excellent
10.1%
Immigrants | South Central Asia
84.6
/100
|
#129
Excellent
10.1%
Immigrants | Lithuania
84.2
/100
|
#130
Excellent
10.1%
Seminole
84.2
/100
|
#131
Excellent
10.1%
Immigrants | South Eastern Asia
84.0
/100
|
#132
Excellent
10.1%
Austrians
83.9
/100
|
#133
Excellent
10.2%
Romanians
83.8
/100
|
#134
Excellent
10.2%
Comanche
83.4
/100
|
#135
Excellent
10.2%
Immigrants | Northern Africa
82.5
/100
|
#136
Excellent
10.2%

Demographics Similar to Iraqis by Unemployment Among Ages 20 to 24 years

In terms of unemployment among ages 20 to 24 years, the demographic groups most similar to Iraqis are Immigrants from Colombia (10.3%, a difference of 0.020%), Immigrants from Fiji (10.3%, a difference of 0.030%), Italian (10.3%, a difference of 0.040%), Lebanese (10.3%, a difference of 0.060%), and Turkish (10.3%, a difference of 0.060%).
DemographicsRating | RankUnemployment Among Ages 20 to 24 years
Indians (Asian)
62.6
/100
|
#161
Good
10.3%
Immigrants | Asia
61.3
/100
|
#162
Good
10.3%
Estonians
61.1
/100
|
#163
Good
10.3%
Immigrants | Korea
59.0
/100
|
#164
Average
10.3%
Lebanese
58.3
/100
|
#165
Average
10.3%
Italians
57.7
/100
|
#166
Average
10.3%
Immigrants | Fiji
57.6
/100
|
#167
Average
10.3%
Iraqis
56.7
/100
|
#168
Average
10.3%
Immigrants | Colombia
56.3
/100
|
#169
Average
10.3%
Turks
55.2
/100
|
#170
Average
10.3%
Immigrants | Eastern Asia
52.7
/100
|
#171
Average
10.3%
Koreans
51.9
/100
|
#172
Average
10.3%
Immigrants | Sweden
50.8
/100
|
#173
Average
10.3%
Ukrainians
50.0
/100
|
#174
Average
10.3%
Samoans
45.4
/100
|
#175
Average
10.3%