Venezuelan vs Osage Unemployment Among Ages 25 to 29 years
COMPARE
Venezuelan
Osage
Unemployment Among Ages 25 to 29 years
Unemployment Among Ages 25 to 29 years Comparison
Venezuelans
Osage
6.2%
UNEMPLOYMENT AMONG AGES 25 TO 29 YEARS
99.1/ 100
METRIC RATING
45th/ 347
METRIC RANK
6.7%
UNEMPLOYMENT AMONG AGES 25 TO 29 YEARS
48.1/ 100
METRIC RATING
176th/ 347
METRIC RANK
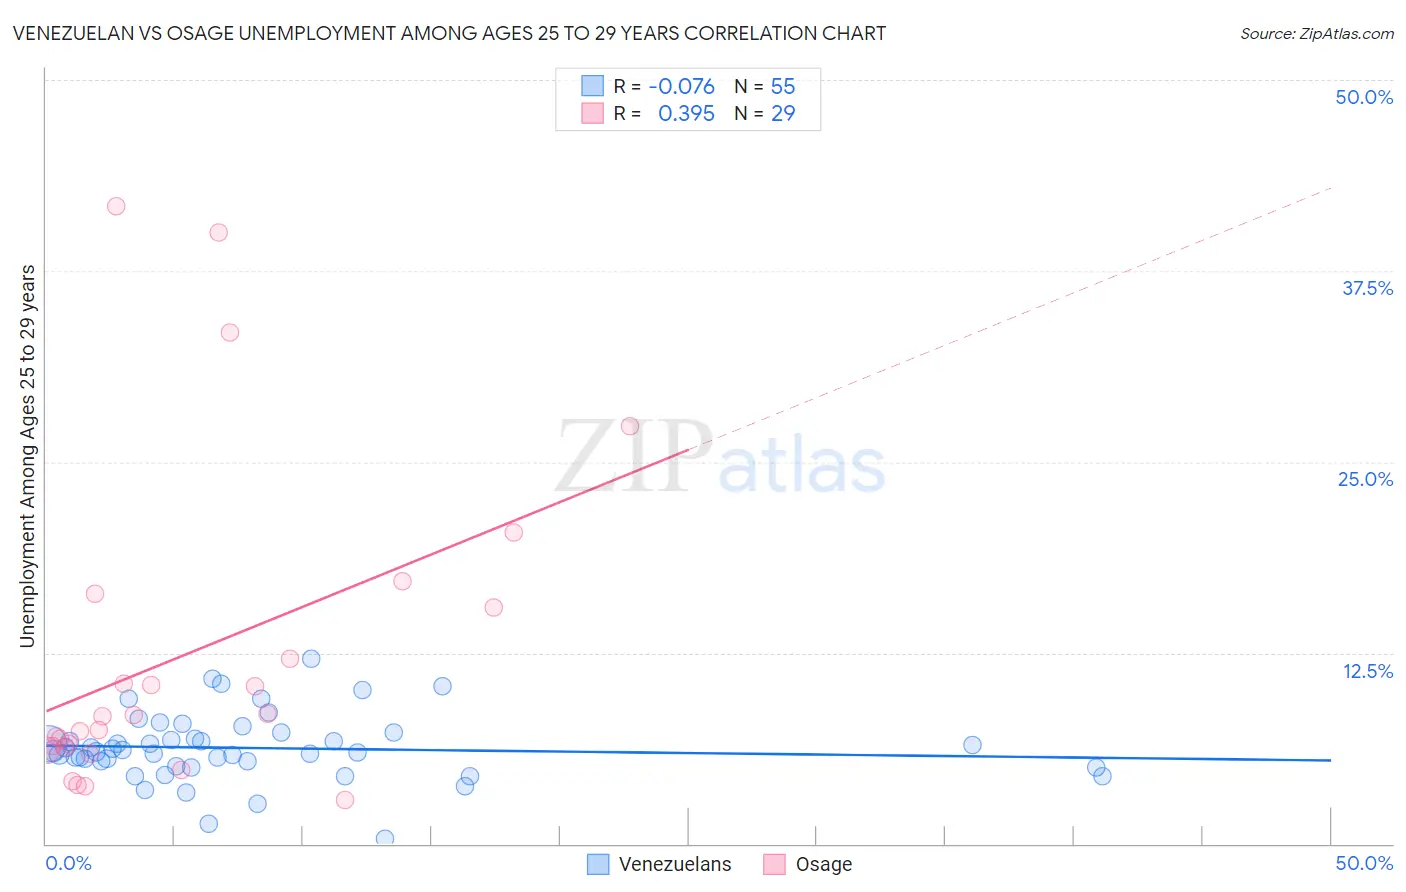
Venezuelan vs Osage Unemployment Among Ages 25 to 29 years Correlation Chart
The statistical analysis conducted on geographies consisting of 296,350,237 people shows a slight negative correlation between the proportion of Venezuelans and unemployment rate among population between the ages 25 and 29 in the United States with a correlation coefficient (R) of -0.076 and weighted average of 6.2%. Similarly, the statistical analysis conducted on geographies consisting of 90,314,239 people shows a mild positive correlation between the proportion of Osage and unemployment rate among population between the ages 25 and 29 in the United States with a correlation coefficient (R) of 0.395 and weighted average of 6.7%, a difference of 7.9%.
Unemployment Among Ages 25 to 29 years Correlation Summary
| Measurement | Venezuelan | Osage |
| Minimum | 0.30% | 2.9% |
| Maximum | 12.1% | 41.7% |
| Range | 11.8% | 38.8% |
| Mean | 6.3% | 12.4% |
| Median | 6.1% | 8.4% |
| Interquartile 25% (IQ1) | 5.1% | 6.2% |
| Interquartile 75% (IQ3) | 7.3% | 16.0% |
| Interquartile Range (IQR) | 2.2% | 9.8% |
| Standard Deviation (Sample) | 2.2% | 10.6% |
| Standard Deviation (Population) | 2.2% | 10.4% |
Similar Demographics by Unemployment Among Ages 25 to 29 years
Demographics Similar to Venezuelans by Unemployment Among Ages 25 to 29 years
In terms of unemployment among ages 25 to 29 years, the demographic groups most similar to Venezuelans are Immigrants from Lithuania (6.2%, a difference of 0.080%), Latvian (6.2%, a difference of 0.10%), Immigrants from Australia (6.2%, a difference of 0.11%), German Russian (6.2%, a difference of 0.18%), and Mongolian (6.2%, a difference of 0.20%).
| Demographics | Rating | Rank | Unemployment Among Ages 25 to 29 years |
| Ethiopians | 99.4 /100 | #38 | Exceptional 6.1% |
| Indonesians | 99.3 /100 | #39 | Exceptional 6.1% |
| Immigrants | Kenya | 99.3 /100 | #40 | Exceptional 6.1% |
| Fijians | 99.3 /100 | #41 | Exceptional 6.1% |
| Jordanians | 99.3 /100 | #42 | Exceptional 6.1% |
| Czechs | 99.2 /100 | #43 | Exceptional 6.2% |
| Mongolians | 99.2 /100 | #44 | Exceptional 6.2% |
| Venezuelans | 99.1 /100 | #45 | Exceptional 6.2% |
| Immigrants | Lithuania | 99.0 /100 | #46 | Exceptional 6.2% |
| Latvians | 99.0 /100 | #47 | Exceptional 6.2% |
| Immigrants | Australia | 99.0 /100 | #48 | Exceptional 6.2% |
| German Russians | 99.0 /100 | #49 | Exceptional 6.2% |
| Soviet Union | 98.9 /100 | #50 | Exceptional 6.2% |
| Burmese | 98.9 /100 | #51 | Exceptional 6.2% |
| Immigrants | Turkey | 98.9 /100 | #52 | Exceptional 6.2% |
Demographics Similar to Osage by Unemployment Among Ages 25 to 29 years
In terms of unemployment among ages 25 to 29 years, the demographic groups most similar to Osage are Immigrants from Israel (6.7%, a difference of 0.020%), Immigrants from South Eastern Asia (6.7%, a difference of 0.060%), Immigrants from North America (6.6%, a difference of 0.12%), Immigrants from Iraq (6.7%, a difference of 0.18%), and Costa Rican (6.7%, a difference of 0.19%).
| Demographics | Rating | Rank | Unemployment Among Ages 25 to 29 years |
| South Americans | 54.5 /100 | #169 | Average 6.6% |
| Albanians | 53.5 /100 | #170 | Average 6.6% |
| Immigrants | Cambodia | 52.6 /100 | #171 | Average 6.6% |
| Bangladeshis | 51.6 /100 | #172 | Average 6.6% |
| Russians | 51.3 /100 | #173 | Average 6.6% |
| Immigrants | North America | 50.0 /100 | #174 | Average 6.6% |
| Immigrants | South Eastern Asia | 49.1 /100 | #175 | Average 6.7% |
| Osage | 48.1 /100 | #176 | Average 6.7% |
| Immigrants | Israel | 47.8 /100 | #177 | Average 6.7% |
| Immigrants | Iraq | 45.1 /100 | #178 | Average 6.7% |
| Costa Ricans | 44.9 /100 | #179 | Average 6.7% |
| Immigrants | Africa | 41.1 /100 | #180 | Average 6.7% |
| Immigrants | Western Europe | 41.1 /100 | #181 | Average 6.7% |
| Czechoslovakians | 40.7 /100 | #182 | Average 6.7% |
| Immigrants | Scotland | 39.6 /100 | #183 | Fair 6.7% |