U.S. Virgin Islander vs Immigrants from Japan Unemployment Among Ages 30 to 34 years
COMPARE
U.S. Virgin Islander
Immigrants from Japan
Unemployment Among Ages 30 to 34 years
Unemployment Among Ages 30 to 34 years Comparison
U.S. Virgin Islanders
Immigrants from Japan
6.3%
UNEMPLOYMENT AMONG AGES 30 TO 34 YEARS
0.0/ 100
METRIC RATING
274th/ 347
METRIC RANK
5.1%
UNEMPLOYMENT AMONG AGES 30 TO 34 YEARS
96.8/ 100
METRIC RATING
65th/ 347
METRIC RANK
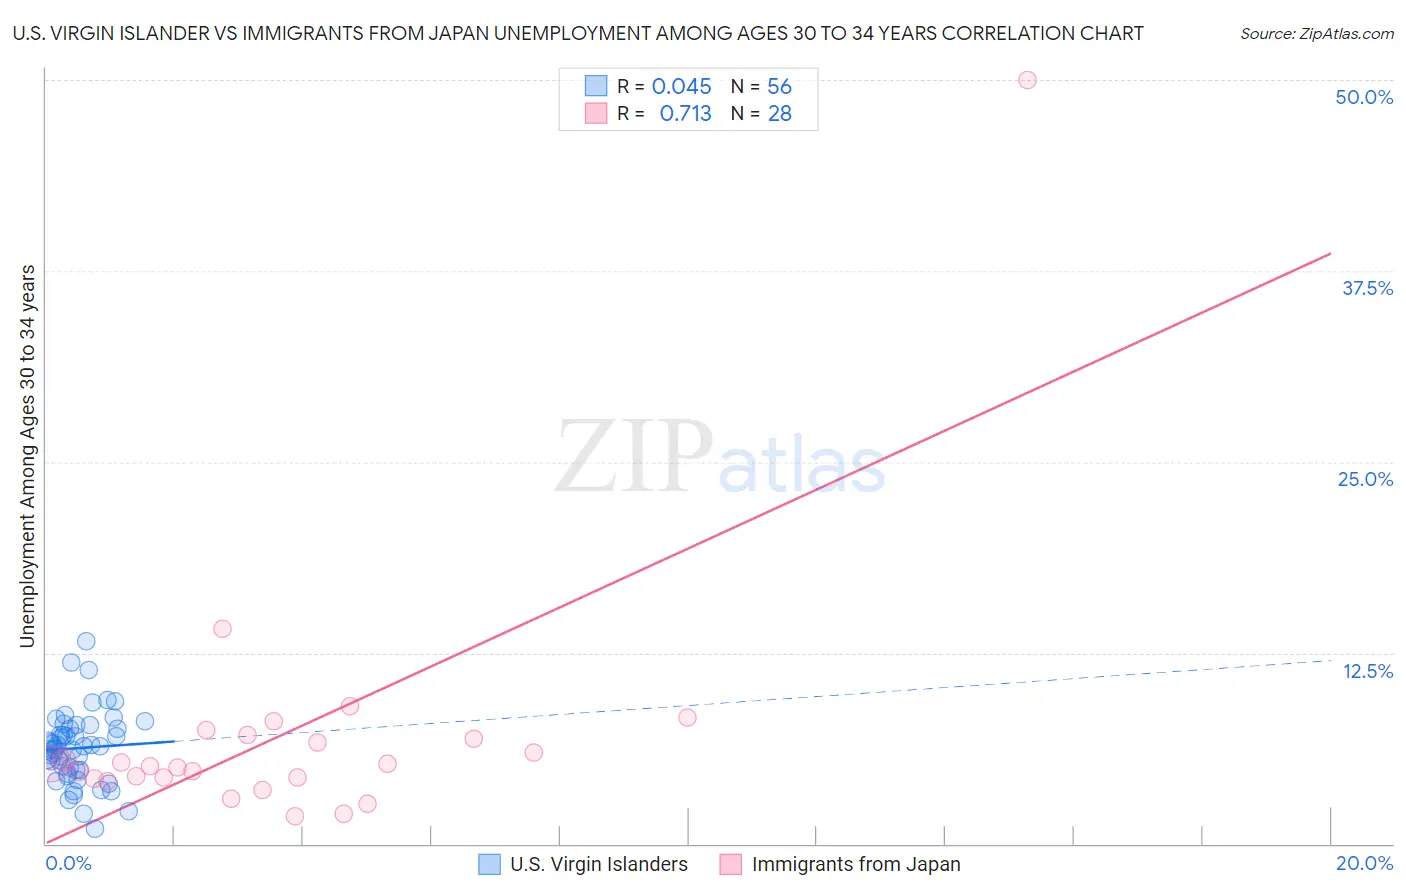
U.S. Virgin Islander vs Immigrants from Japan Unemployment Among Ages 30 to 34 years Correlation Chart
The statistical analysis conducted on geographies consisting of 86,615,171 people shows no correlation between the proportion of U.S. Virgin Islanders and unemployment rate among population between the ages 30 and 34 in the United States with a correlation coefficient (R) of 0.045 and weighted average of 6.3%. Similarly, the statistical analysis conducted on geographies consisting of 324,511,302 people shows a strong positive correlation between the proportion of Immigrants from Japan and unemployment rate among population between the ages 30 and 34 in the United States with a correlation coefficient (R) of 0.713 and weighted average of 5.1%, a difference of 22.2%.
Unemployment Among Ages 30 to 34 years Correlation Summary
| Measurement | U.S. Virgin Islander | Immigrants from Japan |
| Minimum | 1.0% | 1.8% |
| Maximum | 13.2% | 50.0% |
| Range | 12.2% | 48.2% |
| Mean | 6.3% | 7.1% |
| Median | 6.3% | 5.1% |
| Interquartile 25% (IQ1) | 4.8% | 4.3% |
| Interquartile 75% (IQ3) | 7.5% | 7.0% |
| Interquartile Range (IQR) | 2.7% | 2.7% |
| Standard Deviation (Sample) | 2.3% | 8.8% |
| Standard Deviation (Population) | 2.3% | 8.6% |
Similar Demographics by Unemployment Among Ages 30 to 34 years
Demographics Similar to U.S. Virgin Islanders by Unemployment Among Ages 30 to 34 years
In terms of unemployment among ages 30 to 34 years, the demographic groups most similar to U.S. Virgin Islanders are Ottawa (6.3%, a difference of 0.010%), Blackfeet (6.3%, a difference of 0.020%), Ecuadorian (6.3%, a difference of 0.10%), Comanche (6.3%, a difference of 0.13%), and Pennsylvania German (6.3%, a difference of 0.16%).
| Demographics | Rating | Rank | Unemployment Among Ages 30 to 34 years |
| Immigrants | Mexico | 0.0 /100 | #267 | Tragic 6.2% |
| Immigrants | Haiti | 0.0 /100 | #268 | Tragic 6.2% |
| French American Indians | 0.0 /100 | #269 | Tragic 6.3% |
| Immigrants | Senegal | 0.0 /100 | #270 | Tragic 6.3% |
| Comanche | 0.0 /100 | #271 | Tragic 6.3% |
| Blackfeet | 0.0 /100 | #272 | Tragic 6.3% |
| Ottawa | 0.0 /100 | #273 | Tragic 6.3% |
| U.S. Virgin Islanders | 0.0 /100 | #274 | Tragic 6.3% |
| Ecuadorians | 0.0 /100 | #275 | Tragic 6.3% |
| Pennsylvania Germans | 0.0 /100 | #276 | Tragic 6.3% |
| Immigrants | Ecuador | 0.0 /100 | #277 | Tragic 6.3% |
| Osage | 0.0 /100 | #278 | Tragic 6.3% |
| Cree | 0.0 /100 | #279 | Tragic 6.4% |
| Cherokee | 0.0 /100 | #280 | Tragic 6.4% |
| Immigrants | Caribbean | 0.0 /100 | #281 | Tragic 6.4% |
Demographics Similar to Immigrants from Japan by Unemployment Among Ages 30 to 34 years
In terms of unemployment among ages 30 to 34 years, the demographic groups most similar to Immigrants from Japan are Immigrants from Eastern Asia (5.1%, a difference of 0.070%), Immigrants from Zimbabwe (5.1%, a difference of 0.070%), Belgian (5.1%, a difference of 0.10%), Immigrants from France (5.1%, a difference of 0.11%), and Indian (Asian) (5.1%, a difference of 0.13%).
| Demographics | Rating | Rank | Unemployment Among Ages 30 to 34 years |
| Asians | 97.2 /100 | #58 | Exceptional 5.1% |
| Swedes | 97.1 /100 | #59 | Exceptional 5.1% |
| Immigrants | Somalia | 97.1 /100 | #60 | Exceptional 5.1% |
| Indians (Asian) | 97.0 /100 | #61 | Exceptional 5.1% |
| Immigrants | France | 97.0 /100 | #62 | Exceptional 5.1% |
| Belgians | 97.0 /100 | #63 | Exceptional 5.1% |
| Immigrants | Eastern Asia | 96.9 /100 | #64 | Exceptional 5.1% |
| Immigrants | Japan | 96.8 /100 | #65 | Exceptional 5.1% |
| Immigrants | Zimbabwe | 96.7 /100 | #66 | Exceptional 5.1% |
| Burmese | 96.5 /100 | #67 | Exceptional 5.1% |
| Jordanians | 96.5 /100 | #68 | Exceptional 5.1% |
| Immigrants | Northern Africa | 96.4 /100 | #69 | Exceptional 5.1% |
| Immigrants | Iraq | 96.4 /100 | #70 | Exceptional 5.1% |
| Paraguayans | 96.4 /100 | #71 | Exceptional 5.1% |
| Immigrants | Moldova | 96.4 /100 | #72 | Exceptional 5.1% |