Immigrants from Egypt vs Immigrants from Japan Unemployment Among Ages 30 to 34 years
COMPARE
Immigrants from Egypt
Immigrants from Japan
Unemployment Among Ages 30 to 34 years
Unemployment Among Ages 30 to 34 years Comparison
Immigrants from Egypt
Immigrants from Japan
5.2%
UNEMPLOYMENT AMONG AGES 30 TO 34 YEARS
93.9/ 100
METRIC RATING
85th/ 347
METRIC RANK
5.1%
UNEMPLOYMENT AMONG AGES 30 TO 34 YEARS
96.8/ 100
METRIC RATING
65th/ 347
METRIC RANK
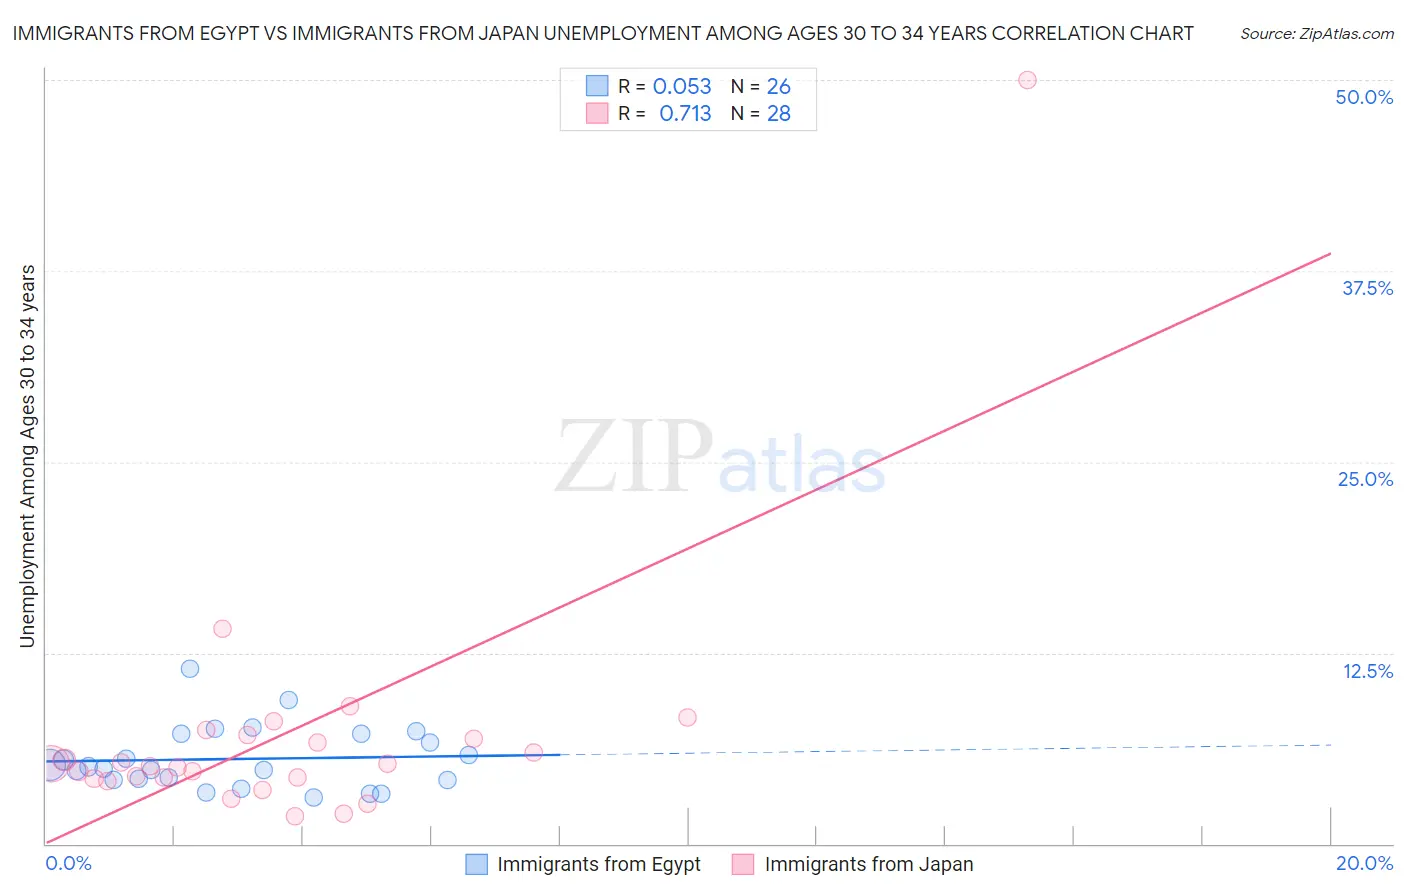
Immigrants from Egypt vs Immigrants from Japan Unemployment Among Ages 30 to 34 years Correlation Chart
The statistical analysis conducted on geographies consisting of 237,575,255 people shows a slight positive correlation between the proportion of Immigrants from Egypt and unemployment rate among population between the ages 30 and 34 in the United States with a correlation coefficient (R) of 0.053 and weighted average of 5.2%. Similarly, the statistical analysis conducted on geographies consisting of 324,511,302 people shows a strong positive correlation between the proportion of Immigrants from Japan and unemployment rate among population between the ages 30 and 34 in the United States with a correlation coefficient (R) of 0.713 and weighted average of 5.1%, a difference of 1.3%.
Unemployment Among Ages 30 to 34 years Correlation Summary
| Measurement | Immigrants from Egypt | Immigrants from Japan |
| Minimum | 3.0% | 1.8% |
| Maximum | 11.4% | 50.0% |
| Range | 8.4% | 48.2% |
| Mean | 5.5% | 7.1% |
| Median | 5.0% | 5.1% |
| Interquartile 25% (IQ1) | 4.2% | 4.3% |
| Interquartile 75% (IQ3) | 7.2% | 7.0% |
| Interquartile Range (IQR) | 3.0% | 2.7% |
| Standard Deviation (Sample) | 2.0% | 8.8% |
| Standard Deviation (Population) | 2.0% | 8.6% |
Demographics Similar to Immigrants from Egypt and Immigrants from Japan by Unemployment Among Ages 30 to 34 years
In terms of unemployment among ages 30 to 34 years, the demographic groups most similar to Immigrants from Egypt are Immigrants from Uganda (5.2%, a difference of 0.030%), Immigrants from Korea (5.2%, a difference of 0.080%), Immigrants from Latvia (5.2%, a difference of 0.11%), Chilean (5.2%, a difference of 0.18%), and Immigrants from Indonesia (5.2%, a difference of 0.29%). Similarly, the demographic groups most similar to Immigrants from Japan are Immigrants from Zimbabwe (5.1%, a difference of 0.070%), Burmese (5.1%, a difference of 0.20%), Jordanian (5.1%, a difference of 0.20%), Immigrants from Northern Africa (5.1%, a difference of 0.21%), and Immigrants from Iraq (5.1%, a difference of 0.22%).
| Demographics | Rating | Rank | Unemployment Among Ages 30 to 34 years |
| Immigrants | Japan | 96.8 /100 | #65 | Exceptional 5.1% |
| Immigrants | Zimbabwe | 96.7 /100 | #66 | Exceptional 5.1% |
| Burmese | 96.5 /100 | #67 | Exceptional 5.1% |
| Jordanians | 96.5 /100 | #68 | Exceptional 5.1% |
| Immigrants | Northern Africa | 96.4 /100 | #69 | Exceptional 5.1% |
| Immigrants | Iraq | 96.4 /100 | #70 | Exceptional 5.1% |
| Paraguayans | 96.4 /100 | #71 | Exceptional 5.1% |
| Immigrants | Moldova | 96.4 /100 | #72 | Exceptional 5.1% |
| Slovenes | 96.2 /100 | #73 | Exceptional 5.2% |
| Immigrants | Asia | 96.2 /100 | #74 | Exceptional 5.2% |
| Iranians | 96.0 /100 | #75 | Exceptional 5.2% |
| Scandinavians | 95.6 /100 | #76 | Exceptional 5.2% |
| Uruguayans | 95.4 /100 | #77 | Exceptional 5.2% |
| Indonesians | 95.1 /100 | #78 | Exceptional 5.2% |
| Immigrants | Lithuania | 95.0 /100 | #79 | Exceptional 5.2% |
| Immigrants | Indonesia | 94.7 /100 | #80 | Exceptional 5.2% |
| Chileans | 94.4 /100 | #81 | Exceptional 5.2% |
| Immigrants | Latvia | 94.2 /100 | #82 | Exceptional 5.2% |
| Immigrants | Korea | 94.1 /100 | #83 | Exceptional 5.2% |
| Immigrants | Uganda | 94.0 /100 | #84 | Exceptional 5.2% |
| Immigrants | Egypt | 93.9 /100 | #85 | Exceptional 5.2% |