U.S. Virgin Islander vs Japanese Unemployment Among Ages 30 to 34 years
COMPARE
U.S. Virgin Islander
Japanese
Unemployment Among Ages 30 to 34 years
Unemployment Among Ages 30 to 34 years Comparison
U.S. Virgin Islanders
Japanese
6.3%
UNEMPLOYMENT AMONG AGES 30 TO 34 YEARS
0.0/ 100
METRIC RATING
274th/ 347
METRIC RANK
5.9%
UNEMPLOYMENT AMONG AGES 30 TO 34 YEARS
1.1/ 100
METRIC RATING
231st/ 347
METRIC RANK
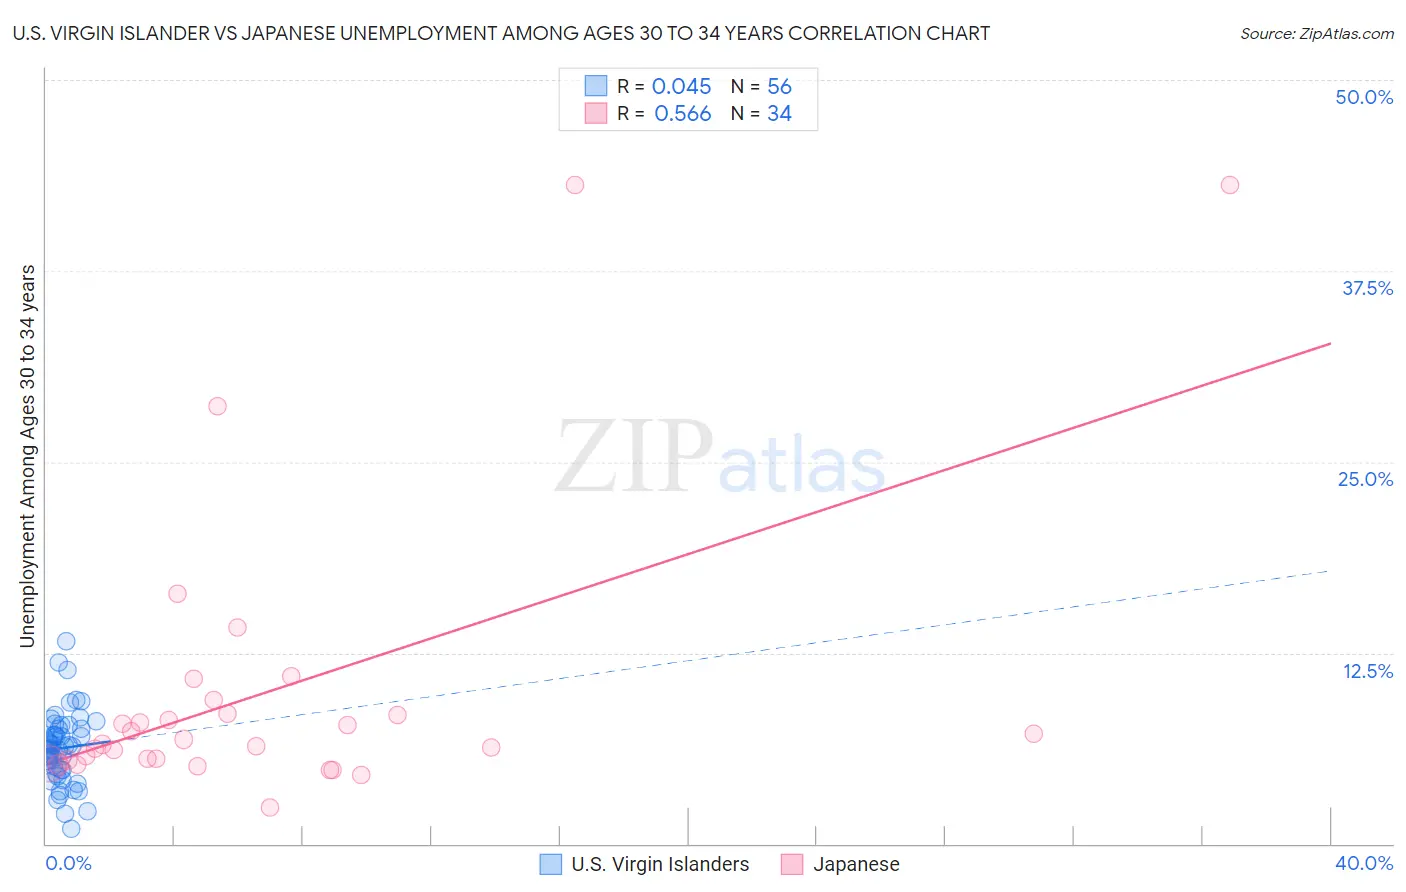
U.S. Virgin Islander vs Japanese Unemployment Among Ages 30 to 34 years Correlation Chart
The statistical analysis conducted on geographies consisting of 86,615,171 people shows no correlation between the proportion of U.S. Virgin Islanders and unemployment rate among population between the ages 30 and 34 in the United States with a correlation coefficient (R) of 0.045 and weighted average of 6.3%. Similarly, the statistical analysis conducted on geographies consisting of 242,582,466 people shows a substantial positive correlation between the proportion of Japanese and unemployment rate among population between the ages 30 and 34 in the United States with a correlation coefficient (R) of 0.566 and weighted average of 5.9%, a difference of 6.6%.
Unemployment Among Ages 30 to 34 years Correlation Summary
| Measurement | U.S. Virgin Islander | Japanese |
| Minimum | 1.0% | 2.4% |
| Maximum | 13.2% | 43.1% |
| Range | 12.2% | 40.7% |
| Mean | 6.3% | 9.9% |
| Median | 6.3% | 6.7% |
| Interquartile 25% (IQ1) | 4.8% | 5.5% |
| Interquartile 75% (IQ3) | 7.5% | 8.5% |
| Interquartile Range (IQR) | 2.7% | 3.0% |
| Standard Deviation (Sample) | 2.3% | 9.6% |
| Standard Deviation (Population) | 2.3% | 9.4% |
Similar Demographics by Unemployment Among Ages 30 to 34 years
Demographics Similar to U.S. Virgin Islanders by Unemployment Among Ages 30 to 34 years
In terms of unemployment among ages 30 to 34 years, the demographic groups most similar to U.S. Virgin Islanders are Ottawa (6.3%, a difference of 0.010%), Blackfeet (6.3%, a difference of 0.020%), Ecuadorian (6.3%, a difference of 0.10%), Comanche (6.3%, a difference of 0.13%), and Pennsylvania German (6.3%, a difference of 0.16%).
| Demographics | Rating | Rank | Unemployment Among Ages 30 to 34 years |
| Immigrants | Mexico | 0.0 /100 | #267 | Tragic 6.2% |
| Immigrants | Haiti | 0.0 /100 | #268 | Tragic 6.2% |
| French American Indians | 0.0 /100 | #269 | Tragic 6.3% |
| Immigrants | Senegal | 0.0 /100 | #270 | Tragic 6.3% |
| Comanche | 0.0 /100 | #271 | Tragic 6.3% |
| Blackfeet | 0.0 /100 | #272 | Tragic 6.3% |
| Ottawa | 0.0 /100 | #273 | Tragic 6.3% |
| U.S. Virgin Islanders | 0.0 /100 | #274 | Tragic 6.3% |
| Ecuadorians | 0.0 /100 | #275 | Tragic 6.3% |
| Pennsylvania Germans | 0.0 /100 | #276 | Tragic 6.3% |
| Immigrants | Ecuador | 0.0 /100 | #277 | Tragic 6.3% |
| Osage | 0.0 /100 | #278 | Tragic 6.3% |
| Cree | 0.0 /100 | #279 | Tragic 6.4% |
| Cherokee | 0.0 /100 | #280 | Tragic 6.4% |
| Immigrants | Caribbean | 0.0 /100 | #281 | Tragic 6.4% |
Demographics Similar to Japanese by Unemployment Among Ages 30 to 34 years
In terms of unemployment among ages 30 to 34 years, the demographic groups most similar to Japanese are Hawaiian (5.9%, a difference of 0.13%), Iroquois (5.9%, a difference of 0.13%), Immigrants from Uzbekistan (5.9%, a difference of 0.45%), Nepalese (5.9%, a difference of 0.51%), and Portuguese (5.9%, a difference of 0.54%).
| Demographics | Rating | Rank | Unemployment Among Ages 30 to 34 years |
| Slovaks | 2.5 /100 | #224 | Tragic 5.8% |
| Samoans | 2.5 /100 | #225 | Tragic 5.8% |
| Liberians | 2.3 /100 | #226 | Tragic 5.8% |
| Spanish | 1.8 /100 | #227 | Tragic 5.8% |
| Immigrants | Bahamas | 1.8 /100 | #228 | Tragic 5.8% |
| Immigrants | Uzbekistan | 1.5 /100 | #229 | Tragic 5.9% |
| Hawaiians | 1.2 /100 | #230 | Tragic 5.9% |
| Japanese | 1.1 /100 | #231 | Tragic 5.9% |
| Iroquois | 1.0 /100 | #232 | Tragic 5.9% |
| Nepalese | 0.8 /100 | #233 | Tragic 5.9% |
| Portuguese | 0.8 /100 | #234 | Tragic 5.9% |
| Yaqui | 0.7 /100 | #235 | Tragic 5.9% |
| Native Hawaiians | 0.7 /100 | #236 | Tragic 5.9% |
| Central Americans | 0.6 /100 | #237 | Tragic 5.9% |
| Mexican American Indians | 0.6 /100 | #238 | Tragic 5.9% |