U.S. Virgin Islander vs Immigrants from Argentina Unemployment Among Ages 65 to 74 years
COMPARE
U.S. Virgin Islander
Immigrants from Argentina
Unemployment Among Ages 65 to 74 years
Unemployment Among Ages 65 to 74 years Comparison
U.S. Virgin Islanders
Immigrants from Argentina
5.8%
UNEMPLOYMENT AMONG AGES 65 TO 74 YEARS
0.0/ 100
METRIC RATING
292nd/ 347
METRIC RANK
5.6%
UNEMPLOYMENT AMONG AGES 65 TO 74 YEARS
0.9/ 100
METRIC RATING
248th/ 347
METRIC RANK
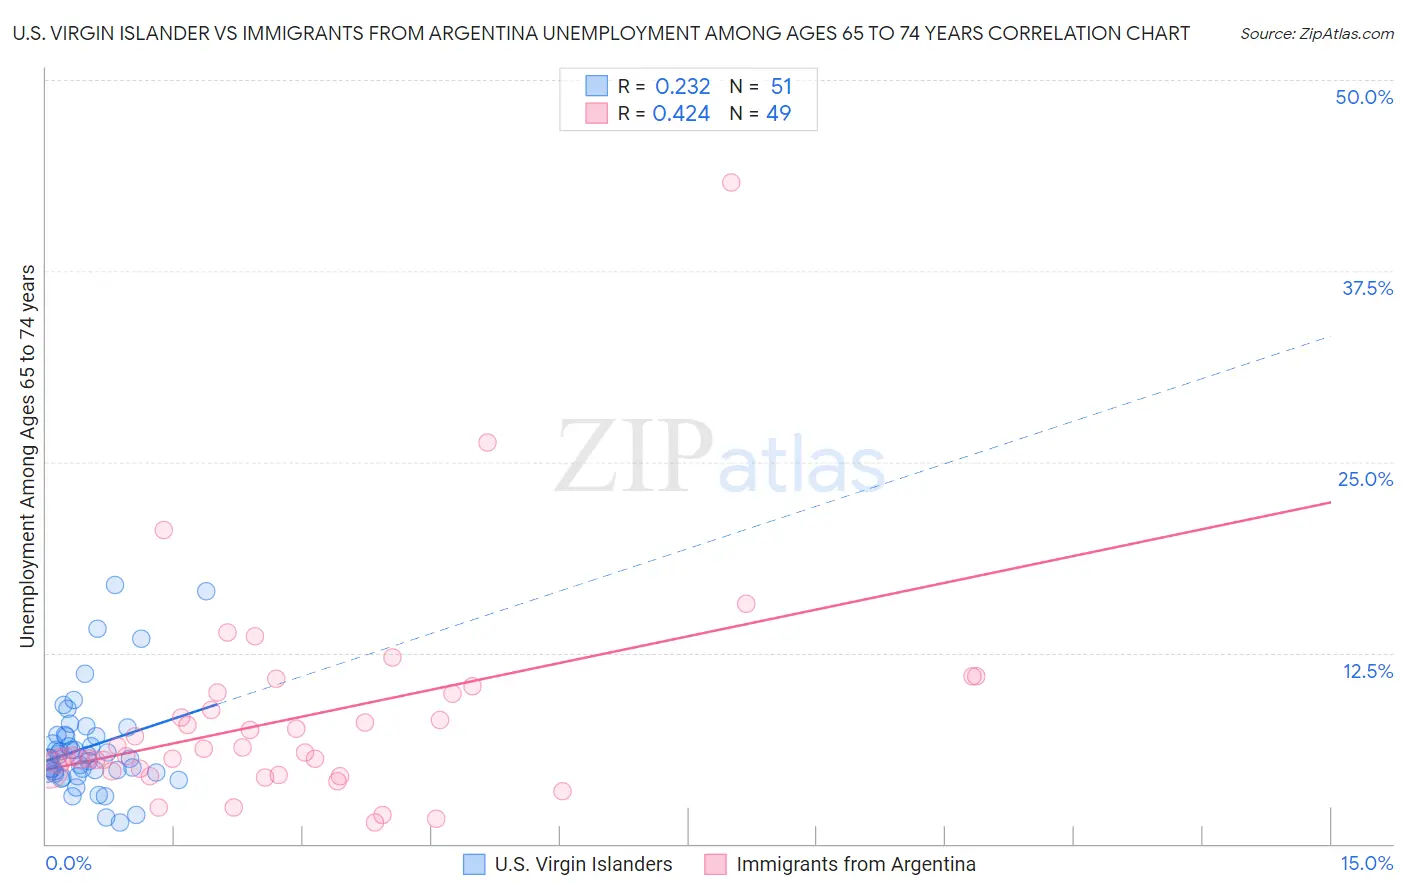
U.S. Virgin Islander vs Immigrants from Argentina Unemployment Among Ages 65 to 74 years Correlation Chart
The statistical analysis conducted on geographies consisting of 84,587,335 people shows a weak positive correlation between the proportion of U.S. Virgin Islanders and unemployment rate among population between the ages 65 and 74 in the United States with a correlation coefficient (R) of 0.232 and weighted average of 5.8%. Similarly, the statistical analysis conducted on geographies consisting of 245,483,192 people shows a moderate positive correlation between the proportion of Immigrants from Argentina and unemployment rate among population between the ages 65 and 74 in the United States with a correlation coefficient (R) of 0.424 and weighted average of 5.6%, a difference of 3.3%.
Unemployment Among Ages 65 to 74 years Correlation Summary
| Measurement | U.S. Virgin Islander | Immigrants from Argentina |
| Minimum | 1.4% | 1.4% |
| Maximum | 16.9% | 43.3% |
| Range | 15.5% | 41.9% |
| Mean | 6.3% | 8.2% |
| Median | 5.6% | 6.0% |
| Interquartile 25% (IQ1) | 4.7% | 4.8% |
| Interquartile 75% (IQ3) | 7.1% | 9.8% |
| Interquartile Range (IQR) | 2.4% | 5.1% |
| Standard Deviation (Sample) | 3.3% | 6.9% |
| Standard Deviation (Population) | 3.2% | 6.8% |
Similar Demographics by Unemployment Among Ages 65 to 74 years
Demographics Similar to U.S. Virgin Islanders by Unemployment Among Ages 65 to 74 years
In terms of unemployment among ages 65 to 74 years, the demographic groups most similar to U.S. Virgin Islanders are Immigrants from Grenada (5.8%, a difference of 0.10%), Immigrants from Morocco (5.8%, a difference of 0.13%), Black/African American (5.8%, a difference of 0.16%), Portuguese (5.7%, a difference of 0.22%), and Spanish American Indian (5.7%, a difference of 0.25%).
| Demographics | Rating | Rank | Unemployment Among Ages 65 to 74 years |
| Immigrants | Sierra Leone | 0.1 /100 | #285 | Tragic 5.7% |
| Marshallese | 0.1 /100 | #286 | Tragic 5.7% |
| Central American Indians | 0.0 /100 | #287 | Tragic 5.7% |
| Central Americans | 0.0 /100 | #288 | Tragic 5.7% |
| Immigrants | Somalia | 0.0 /100 | #289 | Tragic 5.7% |
| Spanish American Indians | 0.0 /100 | #290 | Tragic 5.7% |
| Portuguese | 0.0 /100 | #291 | Tragic 5.7% |
| U.S. Virgin Islanders | 0.0 /100 | #292 | Tragic 5.8% |
| Immigrants | Grenada | 0.0 /100 | #293 | Tragic 5.8% |
| Immigrants | Morocco | 0.0 /100 | #294 | Tragic 5.8% |
| Blacks/African Americans | 0.0 /100 | #295 | Tragic 5.8% |
| Pennsylvania Germans | 0.0 /100 | #296 | Tragic 5.8% |
| Houma | 0.0 /100 | #297 | Tragic 5.8% |
| Immigrants | Latin America | 0.0 /100 | #298 | Tragic 5.8% |
| Barbadians | 0.0 /100 | #299 | Tragic 5.8% |
Demographics Similar to Immigrants from Argentina by Unemployment Among Ages 65 to 74 years
In terms of unemployment among ages 65 to 74 years, the demographic groups most similar to Immigrants from Argentina are Immigrants (5.6%, a difference of 0.0%), Paraguayan (5.6%, a difference of 0.050%), Immigrants from Micronesia (5.6%, a difference of 0.060%), Immigrants from Greece (5.6%, a difference of 0.060%), and Trinidadian and Tobagonian (5.6%, a difference of 0.060%).
| Demographics | Rating | Rank | Unemployment Among Ages 65 to 74 years |
| Cree | 1.4 /100 | #241 | Tragic 5.6% |
| Immigrants | Ghana | 1.4 /100 | #242 | Tragic 5.6% |
| Immigrants | Peru | 1.3 /100 | #243 | Tragic 5.6% |
| Immigrants | Micronesia | 0.9 /100 | #244 | Tragic 5.6% |
| Immigrants | Greece | 0.9 /100 | #245 | Tragic 5.6% |
| Paraguayans | 0.9 /100 | #246 | Tragic 5.6% |
| Immigrants | Immigrants | 0.9 /100 | #247 | Tragic 5.6% |
| Immigrants | Argentina | 0.9 /100 | #248 | Tragic 5.6% |
| Trinidadians and Tobagonians | 0.8 /100 | #249 | Tragic 5.6% |
| Cape Verdeans | 0.7 /100 | #250 | Tragic 5.6% |
| Brazilians | 0.5 /100 | #251 | Tragic 5.6% |
| Colombians | 0.5 /100 | #252 | Tragic 5.6% |
| Immigrants | Brazil | 0.5 /100 | #253 | Tragic 5.6% |
| Immigrants | Costa Rica | 0.5 /100 | #254 | Tragic 5.6% |
| Immigrants | Haiti | 0.4 /100 | #255 | Tragic 5.6% |