Blackfeet vs Immigrants from Argentina Unemployment Among Ages 65 to 74 years
COMPARE
Blackfeet
Immigrants from Argentina
Unemployment Among Ages 65 to 74 years
Unemployment Among Ages 65 to 74 years Comparison
Blackfeet
Immigrants from Argentina
5.5%
UNEMPLOYMENT AMONG AGES 65 TO 74 YEARS
5.8/ 100
METRIC RATING
217th/ 347
METRIC RANK
5.6%
UNEMPLOYMENT AMONG AGES 65 TO 74 YEARS
0.9/ 100
METRIC RATING
248th/ 347
METRIC RANK
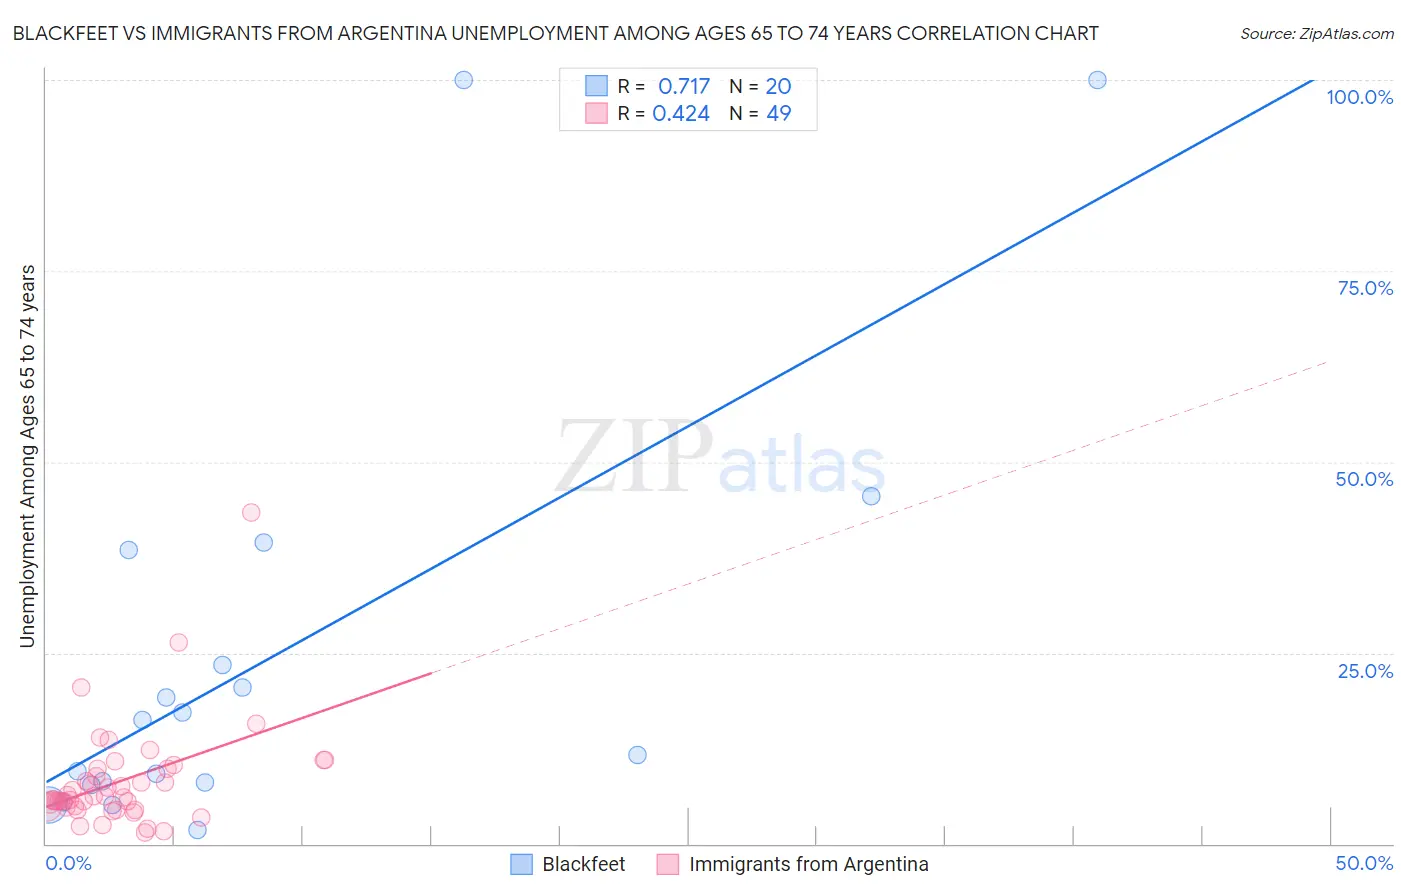
Blackfeet vs Immigrants from Argentina Unemployment Among Ages 65 to 74 years Correlation Chart
The statistical analysis conducted on geographies consisting of 272,615,142 people shows a strong positive correlation between the proportion of Blackfeet and unemployment rate among population between the ages 65 and 74 in the United States with a correlation coefficient (R) of 0.717 and weighted average of 5.5%. Similarly, the statistical analysis conducted on geographies consisting of 245,483,192 people shows a moderate positive correlation between the proportion of Immigrants from Argentina and unemployment rate among population between the ages 65 and 74 in the United States with a correlation coefficient (R) of 0.424 and weighted average of 5.6%, a difference of 1.6%.
Unemployment Among Ages 65 to 74 years Correlation Summary
| Measurement | Blackfeet | Immigrants from Argentina |
| Minimum | 1.8% | 1.4% |
| Maximum | 100.0% | 43.3% |
| Range | 98.2% | 41.9% |
| Mean | 24.6% | 8.2% |
| Median | 13.9% | 6.0% |
| Interquartile 25% (IQ1) | 7.9% | 4.8% |
| Interquartile 75% (IQ3) | 30.9% | 9.8% |
| Interquartile Range (IQR) | 23.0% | 5.1% |
| Standard Deviation (Sample) | 28.6% | 6.9% |
| Standard Deviation (Population) | 27.8% | 6.8% |
Similar Demographics by Unemployment Among Ages 65 to 74 years
Demographics Similar to Blackfeet by Unemployment Among Ages 65 to 74 years
In terms of unemployment among ages 65 to 74 years, the demographic groups most similar to Blackfeet are Samoan (5.5%, a difference of 0.020%), Alsatian (5.5%, a difference of 0.040%), Uruguayan (5.5%, a difference of 0.060%), Immigrants from Syria (5.5%, a difference of 0.12%), and Spaniard (5.5%, a difference of 0.17%).
| Demographics | Rating | Rank | Unemployment Among Ages 65 to 74 years |
| Immigrants | Northern Africa | 10.1 /100 | #210 | Poor 5.5% |
| Immigrants | Croatia | 9.1 /100 | #211 | Tragic 5.5% |
| Haitians | 7.7 /100 | #212 | Tragic 5.5% |
| Italians | 7.7 /100 | #213 | Tragic 5.5% |
| Egyptians | 7.6 /100 | #214 | Tragic 5.5% |
| Americans | 7.3 /100 | #215 | Tragic 5.5% |
| Uruguayans | 6.2 /100 | #216 | Tragic 5.5% |
| Blackfeet | 5.8 /100 | #217 | Tragic 5.5% |
| Samoans | 5.7 /100 | #218 | Tragic 5.5% |
| Alsatians | 5.6 /100 | #219 | Tragic 5.5% |
| Immigrants | Syria | 5.1 /100 | #220 | Tragic 5.5% |
| Spaniards | 4.8 /100 | #221 | Tragic 5.5% |
| Apache | 4.5 /100 | #222 | Tragic 5.5% |
| Hungarians | 4.4 /100 | #223 | Tragic 5.5% |
| Immigrants | Uruguay | 4.2 /100 | #224 | Tragic 5.5% |
Demographics Similar to Immigrants from Argentina by Unemployment Among Ages 65 to 74 years
In terms of unemployment among ages 65 to 74 years, the demographic groups most similar to Immigrants from Argentina are Immigrants (5.6%, a difference of 0.0%), Paraguayan (5.6%, a difference of 0.050%), Immigrants from Micronesia (5.6%, a difference of 0.060%), Immigrants from Greece (5.6%, a difference of 0.060%), and Trinidadian and Tobagonian (5.6%, a difference of 0.060%).
| Demographics | Rating | Rank | Unemployment Among Ages 65 to 74 years |
| Cree | 1.4 /100 | #241 | Tragic 5.6% |
| Immigrants | Ghana | 1.4 /100 | #242 | Tragic 5.6% |
| Immigrants | Peru | 1.3 /100 | #243 | Tragic 5.6% |
| Immigrants | Micronesia | 0.9 /100 | #244 | Tragic 5.6% |
| Immigrants | Greece | 0.9 /100 | #245 | Tragic 5.6% |
| Paraguayans | 0.9 /100 | #246 | Tragic 5.6% |
| Immigrants | Immigrants | 0.9 /100 | #247 | Tragic 5.6% |
| Immigrants | Argentina | 0.9 /100 | #248 | Tragic 5.6% |
| Trinidadians and Tobagonians | 0.8 /100 | #249 | Tragic 5.6% |
| Cape Verdeans | 0.7 /100 | #250 | Tragic 5.6% |
| Brazilians | 0.5 /100 | #251 | Tragic 5.6% |
| Colombians | 0.5 /100 | #252 | Tragic 5.6% |
| Immigrants | Brazil | 0.5 /100 | #253 | Tragic 5.6% |
| Immigrants | Costa Rica | 0.5 /100 | #254 | Tragic 5.6% |
| Immigrants | Haiti | 0.4 /100 | #255 | Tragic 5.6% |