Turkish vs Cuban Unemployment Among Ages 30 to 34 years
COMPARE
Turkish
Cuban
Unemployment Among Ages 30 to 34 years
Unemployment Among Ages 30 to 34 years Comparison
Turks
Cubans
5.1%
UNEMPLOYMENT AMONG AGES 30 TO 34 YEARS
98.2/ 100
METRIC RATING
51st/ 347
METRIC RANK
5.1%
UNEMPLOYMENT AMONG AGES 30 TO 34 YEARS
98.1/ 100
METRIC RATING
53rd/ 347
METRIC RANK
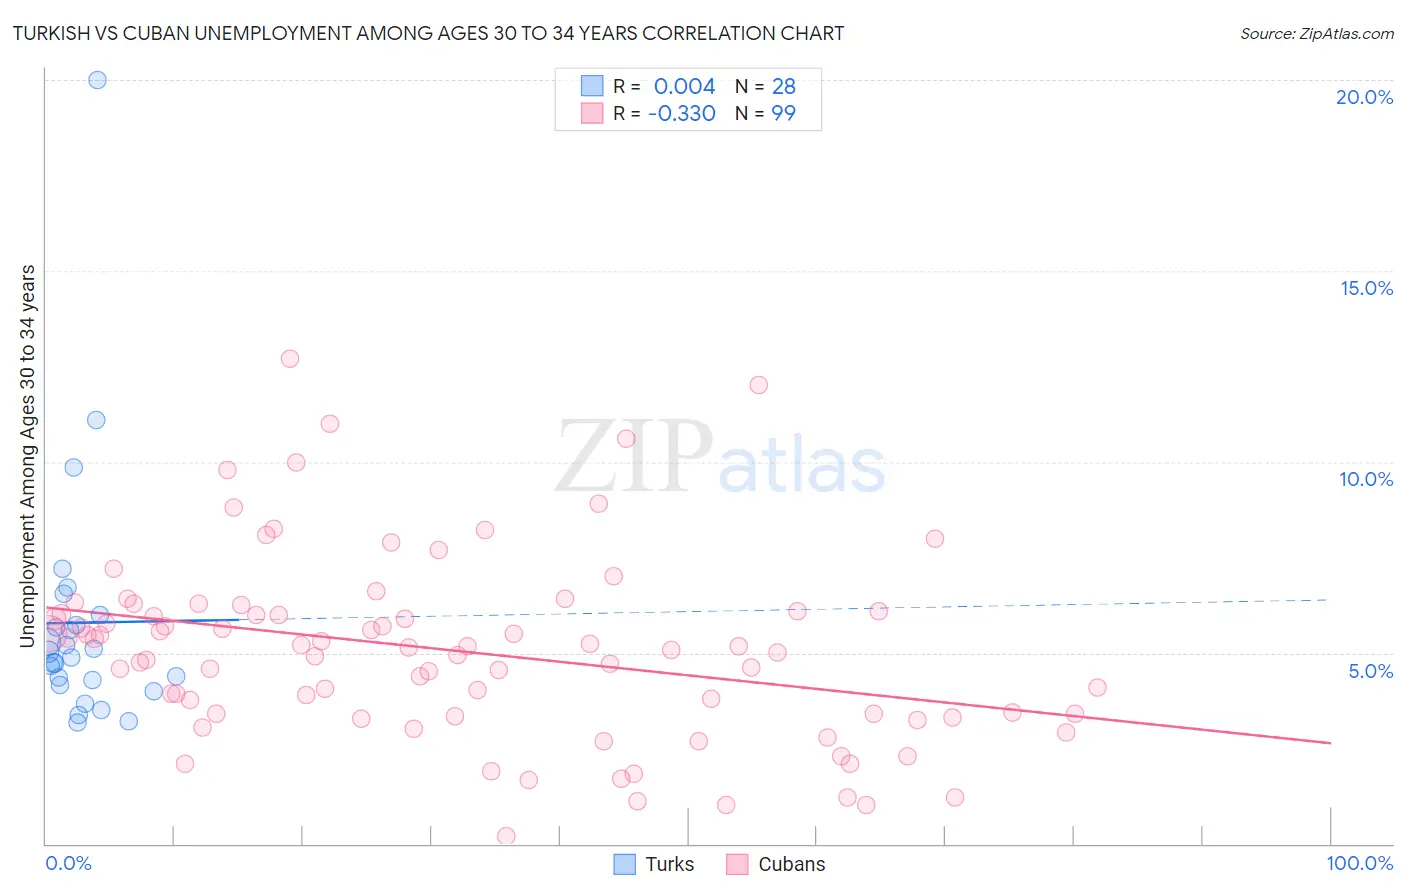
Turkish vs Cuban Unemployment Among Ages 30 to 34 years Correlation Chart
The statistical analysis conducted on geographies consisting of 260,750,898 people shows no correlation between the proportion of Turks and unemployment rate among population between the ages 30 and 34 in the United States with a correlation coefficient (R) of 0.004 and weighted average of 5.1%. Similarly, the statistical analysis conducted on geographies consisting of 419,532,722 people shows a mild negative correlation between the proportion of Cubans and unemployment rate among population between the ages 30 and 34 in the United States with a correlation coefficient (R) of -0.330 and weighted average of 5.1%, a difference of 0.090%.
Unemployment Among Ages 30 to 34 years Correlation Summary
| Measurement | Turkish | Cuban |
| Minimum | 3.2% | 0.20% |
| Maximum | 20.0% | 12.7% |
| Range | 16.8% | 12.5% |
| Mean | 5.8% | 5.1% |
| Median | 4.9% | 5.1% |
| Interquartile 25% (IQ1) | 4.2% | 3.4% |
| Interquartile 75% (IQ3) | 5.9% | 6.1% |
| Interquartile Range (IQR) | 1.6% | 2.7% |
| Standard Deviation (Sample) | 3.3% | 2.4% |
| Standard Deviation (Population) | 3.3% | 2.4% |
Demographics Similar to Turks and Cubans by Unemployment Among Ages 30 to 34 years
In terms of unemployment among ages 30 to 34 years, the demographic groups most similar to Turks are Puget Sound Salish (5.1%, a difference of 0.030%), Immigrants from Burma/Myanmar (5.1%, a difference of 0.040%), Immigrants from Malaysia (5.1%, a difference of 0.11%), Assyrian/Chaldean/Syriac (5.1%, a difference of 0.23%), and Cypriot (5.1%, a difference of 0.25%). Similarly, the demographic groups most similar to Cubans are Immigrants from Burma/Myanmar (5.1%, a difference of 0.050%), Puget Sound Salish (5.1%, a difference of 0.12%), Immigrants from Morocco (5.1%, a difference of 0.18%), Immigrants from Malaysia (5.1%, a difference of 0.19%), and Assyrian/Chaldean/Syriac (5.1%, a difference of 0.32%).
| Demographics | Rating | Rank | Unemployment Among Ages 30 to 34 years |
| Immigrants | Hong Kong | 98.8 /100 | #42 | Exceptional 5.0% |
| Soviet Union | 98.8 /100 | #43 | Exceptional 5.0% |
| Immigrants | Belgium | 98.7 /100 | #44 | Exceptional 5.1% |
| Yugoslavians | 98.6 /100 | #45 | Exceptional 5.1% |
| Immigrants | Congo | 98.4 /100 | #46 | Exceptional 5.1% |
| Cypriots | 98.4 /100 | #47 | Exceptional 5.1% |
| Assyrians/Chaldeans/Syriacs | 98.4 /100 | #48 | Exceptional 5.1% |
| Immigrants | Malaysia | 98.3 /100 | #49 | Exceptional 5.1% |
| Puget Sound Salish | 98.2 /100 | #50 | Exceptional 5.1% |
| Turks | 98.2 /100 | #51 | Exceptional 5.1% |
| Immigrants | Burma/Myanmar | 98.1 /100 | #52 | Exceptional 5.1% |
| Cubans | 98.1 /100 | #53 | Exceptional 5.1% |
| Immigrants | Morocco | 97.9 /100 | #54 | Exceptional 5.1% |
| Chinese | 97.7 /100 | #55 | Exceptional 5.1% |
| Immigrants | Serbia | 97.4 /100 | #56 | Exceptional 5.1% |
| Immigrants | China | 97.2 /100 | #57 | Exceptional 5.1% |
| Asians | 97.2 /100 | #58 | Exceptional 5.1% |
| Swedes | 97.1 /100 | #59 | Exceptional 5.1% |
| Immigrants | Somalia | 97.1 /100 | #60 | Exceptional 5.1% |
| Indians (Asian) | 97.0 /100 | #61 | Exceptional 5.1% |
| Immigrants | France | 97.0 /100 | #62 | Exceptional 5.1% |