Turkish vs Norwegian Unemployment Among Women with Children Ages 6 to 17 years
COMPARE
Turkish
Norwegian
Unemployment Among Women with Children Ages 6 to 17 years
Unemployment Among Women with Children Ages 6 to 17 years Comparison
Turks
Norwegians
8.9%
UNEMPLOYMENT AMONG WOMEN WITH CHILDREN AGES 6 TO 17 YEARS
54.1/ 100
METRIC RATING
170th/ 347
METRIC RANK
8.3%
UNEMPLOYMENT AMONG WOMEN WITH CHILDREN AGES 6 TO 17 YEARS
99.9/ 100
METRIC RATING
70th/ 347
METRIC RANK
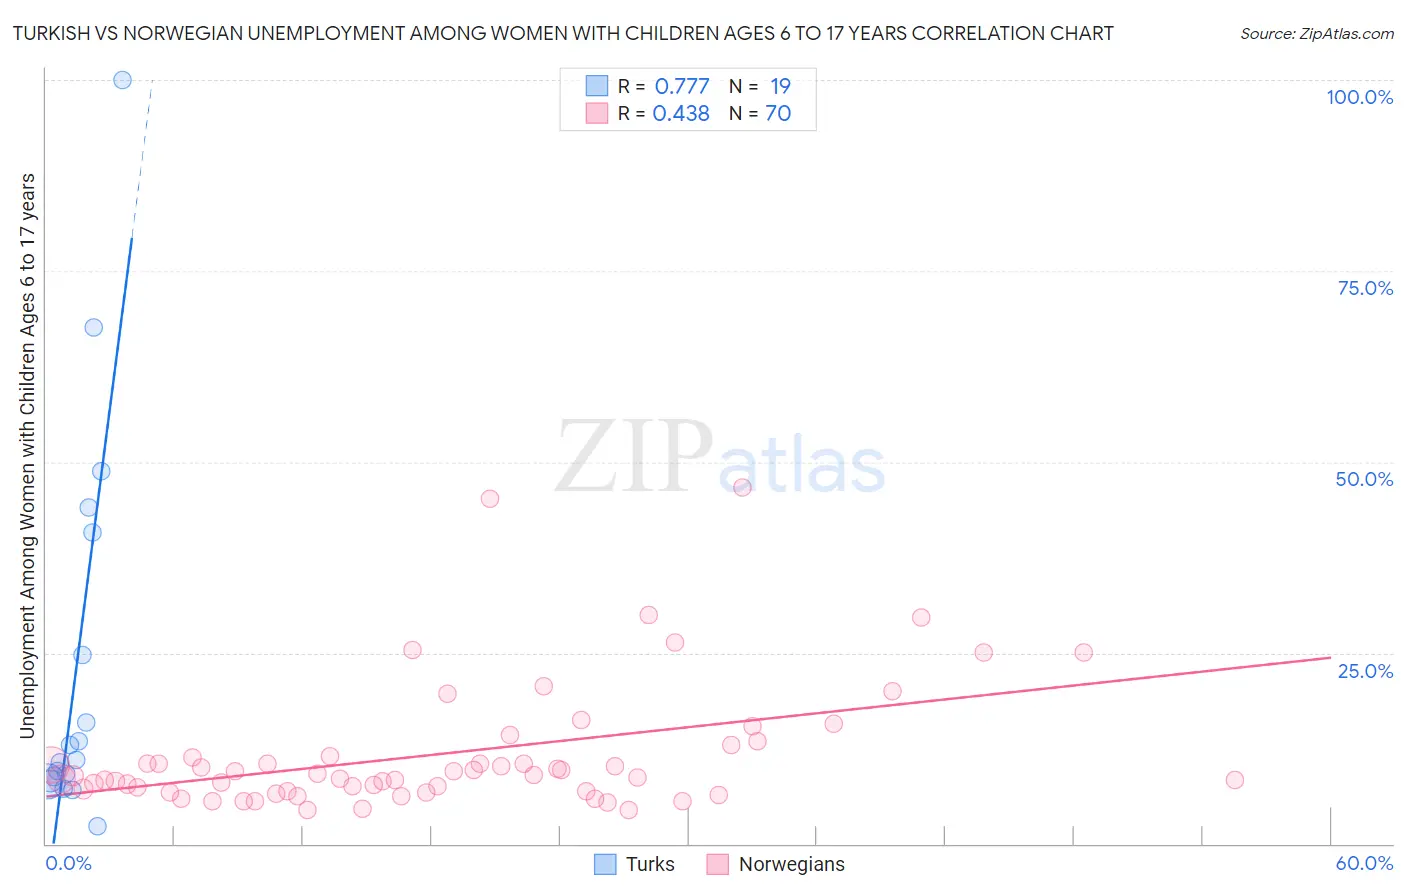
Turkish vs Norwegian Unemployment Among Women with Children Ages 6 to 17 years Correlation Chart
The statistical analysis conducted on geographies consisting of 207,852,412 people shows a strong positive correlation between the proportion of Turks and unemployment rate among women with children between the ages 6 and 17 in the United States with a correlation coefficient (R) of 0.777 and weighted average of 8.9%. Similarly, the statistical analysis conducted on geographies consisting of 341,583,618 people shows a moderate positive correlation between the proportion of Norwegians and unemployment rate among women with children between the ages 6 and 17 in the United States with a correlation coefficient (R) of 0.438 and weighted average of 8.3%, a difference of 7.6%.
Unemployment Among Women with Children Ages 6 to 17 years Correlation Summary
| Measurement | Turkish | Norwegian |
| Minimum | 2.3% | 4.3% |
| Maximum | 100.0% | 46.7% |
| Range | 97.7% | 42.4% |
| Mean | 23.7% | 11.8% |
| Median | 10.9% | 8.9% |
| Interquartile 25% (IQ1) | 8.2% | 6.9% |
| Interquartile 75% (IQ3) | 40.8% | 11.4% |
| Interquartile Range (IQR) | 32.6% | 4.5% |
| Standard Deviation (Sample) | 25.6% | 8.5% |
| Standard Deviation (Population) | 25.0% | 8.4% |
Similar Demographics by Unemployment Among Women with Children Ages 6 to 17 years
Demographics Similar to Turks by Unemployment Among Women with Children Ages 6 to 17 years
In terms of unemployment among women with children ages 6 to 17 years, the demographic groups most similar to Turks are British (8.9%, a difference of 0.050%), Jordanian (9.0%, a difference of 0.090%), Immigrants from West Indies (9.0%, a difference of 0.090%), Immigrants from Croatia (8.9%, a difference of 0.13%), and Immigrants from Brazil (9.0%, a difference of 0.14%).
| Demographics | Rating | Rank | Unemployment Among Women with Children Ages 6 to 17 years |
| Mexican American Indians | 60.6 /100 | #163 | Good 8.9% |
| Ukrainians | 59.7 /100 | #164 | Average 8.9% |
| Immigrants | Micronesia | 59.2 /100 | #165 | Average 8.9% |
| Moroccans | 58.3 /100 | #166 | Average 8.9% |
| Immigrants | England | 57.7 /100 | #167 | Average 8.9% |
| Immigrants | Croatia | 57.1 /100 | #168 | Average 8.9% |
| British | 55.2 /100 | #169 | Average 8.9% |
| Turks | 54.1 /100 | #170 | Average 8.9% |
| Jordanians | 52.2 /100 | #171 | Average 9.0% |
| Immigrants | West Indies | 52.2 /100 | #172 | Average 9.0% |
| Immigrants | Brazil | 51.0 /100 | #173 | Average 9.0% |
| Immigrants | Costa Rica | 50.0 /100 | #174 | Average 9.0% |
| Immigrants | Sierra Leone | 45.9 /100 | #175 | Average 9.0% |
| Immigrants | Italy | 43.7 /100 | #176 | Average 9.0% |
| Immigrants | Jordan | 41.6 /100 | #177 | Average 9.0% |
Demographics Similar to Norwegians by Unemployment Among Women with Children Ages 6 to 17 years
In terms of unemployment among women with children ages 6 to 17 years, the demographic groups most similar to Norwegians are Immigrants from Australia (8.3%, a difference of 0.060%), Immigrants from Thailand (8.3%, a difference of 0.080%), Immigrants from Nepal (8.3%, a difference of 0.10%), Marshallese (8.3%, a difference of 0.11%), and Armenian (8.3%, a difference of 0.19%).
| Demographics | Rating | Rank | Unemployment Among Women with Children Ages 6 to 17 years |
| Immigrants | South Eastern Asia | 99.9 /100 | #63 | Exceptional 8.2% |
| Immigrants | Kuwait | 99.9 /100 | #64 | Exceptional 8.3% |
| Immigrants | Albania | 99.9 /100 | #65 | Exceptional 8.3% |
| Luxembourgers | 99.9 /100 | #66 | Exceptional 8.3% |
| Armenians | 99.9 /100 | #67 | Exceptional 8.3% |
| Marshallese | 99.9 /100 | #68 | Exceptional 8.3% |
| Immigrants | Thailand | 99.9 /100 | #69 | Exceptional 8.3% |
| Norwegians | 99.9 /100 | #70 | Exceptional 8.3% |
| Immigrants | Australia | 99.8 /100 | #71 | Exceptional 8.3% |
| Immigrants | Nepal | 99.8 /100 | #72 | Exceptional 8.3% |
| Spanish Americans | 99.8 /100 | #73 | Exceptional 8.4% |
| Samoans | 99.7 /100 | #74 | Exceptional 8.4% |
| Immigrants | Sri Lanka | 99.7 /100 | #75 | Exceptional 8.4% |
| Immigrants | Moldova | 99.7 /100 | #76 | Exceptional 8.4% |
| Iraqis | 99.7 /100 | #77 | Exceptional 8.4% |