Immigrants from El Salvador vs Estonian Unemployment Among Ages 16 to 19 years
COMPARE
Immigrants from El Salvador
Estonian
Unemployment Among Ages 16 to 19 years
Unemployment Among Ages 16 to 19 years Comparison
Immigrants from El Salvador
Estonians
19.1%
UNEMPLOYMENT AMONG AGES 16 TO 19 YEARS
0.1/ 100
METRIC RATING
268th/ 347
METRIC RANK
17.0%
UNEMPLOYMENT AMONG AGES 16 TO 19 YEARS
94.3/ 100
METRIC RATING
106th/ 347
METRIC RANK
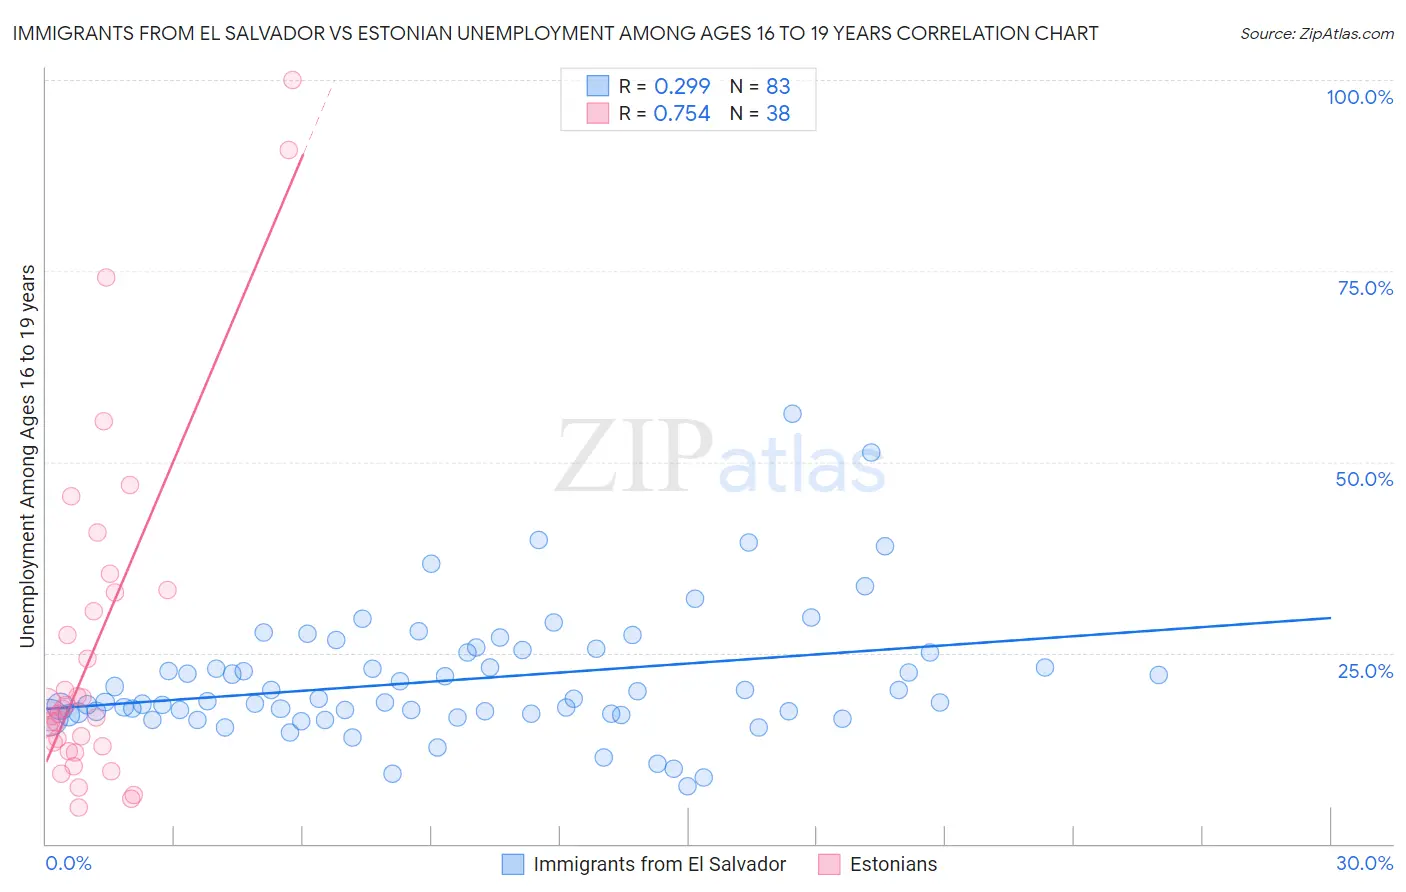
Immigrants from El Salvador vs Estonian Unemployment Among Ages 16 to 19 years Correlation Chart
The statistical analysis conducted on geographies consisting of 342,569,463 people shows a weak positive correlation between the proportion of Immigrants from El Salvador and unemployment rate among population between the ages 16 and 19 in the United States with a correlation coefficient (R) of 0.299 and weighted average of 19.1%. Similarly, the statistical analysis conducted on geographies consisting of 120,320,445 people shows a strong positive correlation between the proportion of Estonians and unemployment rate among population between the ages 16 and 19 in the United States with a correlation coefficient (R) of 0.754 and weighted average of 17.0%, a difference of 12.4%.
Unemployment Among Ages 16 to 19 years Correlation Summary
| Measurement | Immigrants from El Salvador | Estonian |
| Minimum | 7.6% | 4.7% |
| Maximum | 56.3% | 100.0% |
| Range | 48.7% | 95.3% |
| Mean | 21.5% | 25.7% |
| Median | 18.6% | 17.4% |
| Interquartile 25% (IQ1) | 17.0% | 12.7% |
| Interquartile 75% (IQ3) | 25.1% | 32.9% |
| Interquartile Range (IQR) | 8.1% | 20.2% |
| Standard Deviation (Sample) | 8.4% | 22.3% |
| Standard Deviation (Population) | 8.3% | 22.0% |
Similar Demographics by Unemployment Among Ages 16 to 19 years
Demographics Similar to Immigrants from El Salvador by Unemployment Among Ages 16 to 19 years
In terms of unemployment among ages 16 to 19 years, the demographic groups most similar to Immigrants from El Salvador are Lumbee (19.1%, a difference of 0.080%), Honduran (19.2%, a difference of 0.26%), Israeli (19.0%, a difference of 0.28%), Immigrants from Honduras (19.0%, a difference of 0.62%), and Blackfeet (19.2%, a difference of 0.64%).
| Demographics | Rating | Rank | Unemployment Among Ages 16 to 19 years |
| Spanish American Indians | 0.1 /100 | #261 | Tragic 18.9% |
| Salvadorans | 0.1 /100 | #262 | Tragic 18.9% |
| Cree | 0.1 /100 | #263 | Tragic 19.0% |
| Yaqui | 0.1 /100 | #264 | Tragic 19.0% |
| Choctaw | 0.1 /100 | #265 | Tragic 19.0% |
| Immigrants | Honduras | 0.1 /100 | #266 | Tragic 19.0% |
| Israelis | 0.1 /100 | #267 | Tragic 19.0% |
| Immigrants | El Salvador | 0.1 /100 | #268 | Tragic 19.1% |
| Lumbee | 0.1 /100 | #269 | Tragic 19.1% |
| Hondurans | 0.1 /100 | #270 | Tragic 19.2% |
| Blackfeet | 0.0 /100 | #271 | Tragic 19.2% |
| Hispanics or Latinos | 0.0 /100 | #272 | Tragic 19.2% |
| Immigrants | Panama | 0.0 /100 | #273 | Tragic 19.3% |
| Shoshone | 0.0 /100 | #274 | Tragic 19.3% |
| Paraguayans | 0.0 /100 | #275 | Tragic 19.4% |
Demographics Similar to Estonians by Unemployment Among Ages 16 to 19 years
In terms of unemployment among ages 16 to 19 years, the demographic groups most similar to Estonians are Immigrants from Bulgaria (17.0%, a difference of 0.0%), Immigrants from Brazil (17.0%, a difference of 0.030%), Malaysian (17.0%, a difference of 0.030%), Palestinian (17.0%, a difference of 0.050%), and Italian (17.0%, a difference of 0.050%).
| Demographics | Rating | Rank | Unemployment Among Ages 16 to 19 years |
| Immigrants | Lithuania | 94.9 /100 | #99 | Exceptional 17.0% |
| Immigrants | Thailand | 94.7 /100 | #100 | Exceptional 17.0% |
| Immigrants | Saudi Arabia | 94.7 /100 | #101 | Exceptional 17.0% |
| Immigrants | Pakistan | 94.6 /100 | #102 | Exceptional 17.0% |
| Palestinians | 94.6 /100 | #103 | Exceptional 17.0% |
| Italians | 94.5 /100 | #104 | Exceptional 17.0% |
| Immigrants | Bulgaria | 94.3 /100 | #105 | Exceptional 17.0% |
| Estonians | 94.3 /100 | #106 | Exceptional 17.0% |
| Immigrants | Brazil | 94.2 /100 | #107 | Exceptional 17.0% |
| Malaysians | 94.2 /100 | #108 | Exceptional 17.0% |
| Iranians | 94.1 /100 | #109 | Exceptional 17.0% |
| Immigrants | Netherlands | 93.9 /100 | #110 | Exceptional 17.0% |
| Immigrants | Asia | 93.9 /100 | #111 | Exceptional 17.0% |
| Immigrants | Iraq | 93.7 /100 | #112 | Exceptional 17.0% |
| Icelanders | 93.4 /100 | #113 | Exceptional 17.0% |