Immigrants from Taiwan vs Venezuelan Unemployment Among Youth under 25 years
COMPARE
Immigrants from Taiwan
Venezuelan
Unemployment Among Youth under 25 years
Unemployment Among Youth under 25 years Comparison
Immigrants from Taiwan
Venezuelans
11.2%
UNEMPLOYMENT AMONG YOUTH UNDER 25 YEARS
95.1/ 100
METRIC RATING
91st/ 347
METRIC RANK
10.6%
UNEMPLOYMENT AMONG YOUTH UNDER 25 YEARS
100.0/ 100
METRIC RATING
16th/ 347
METRIC RANK
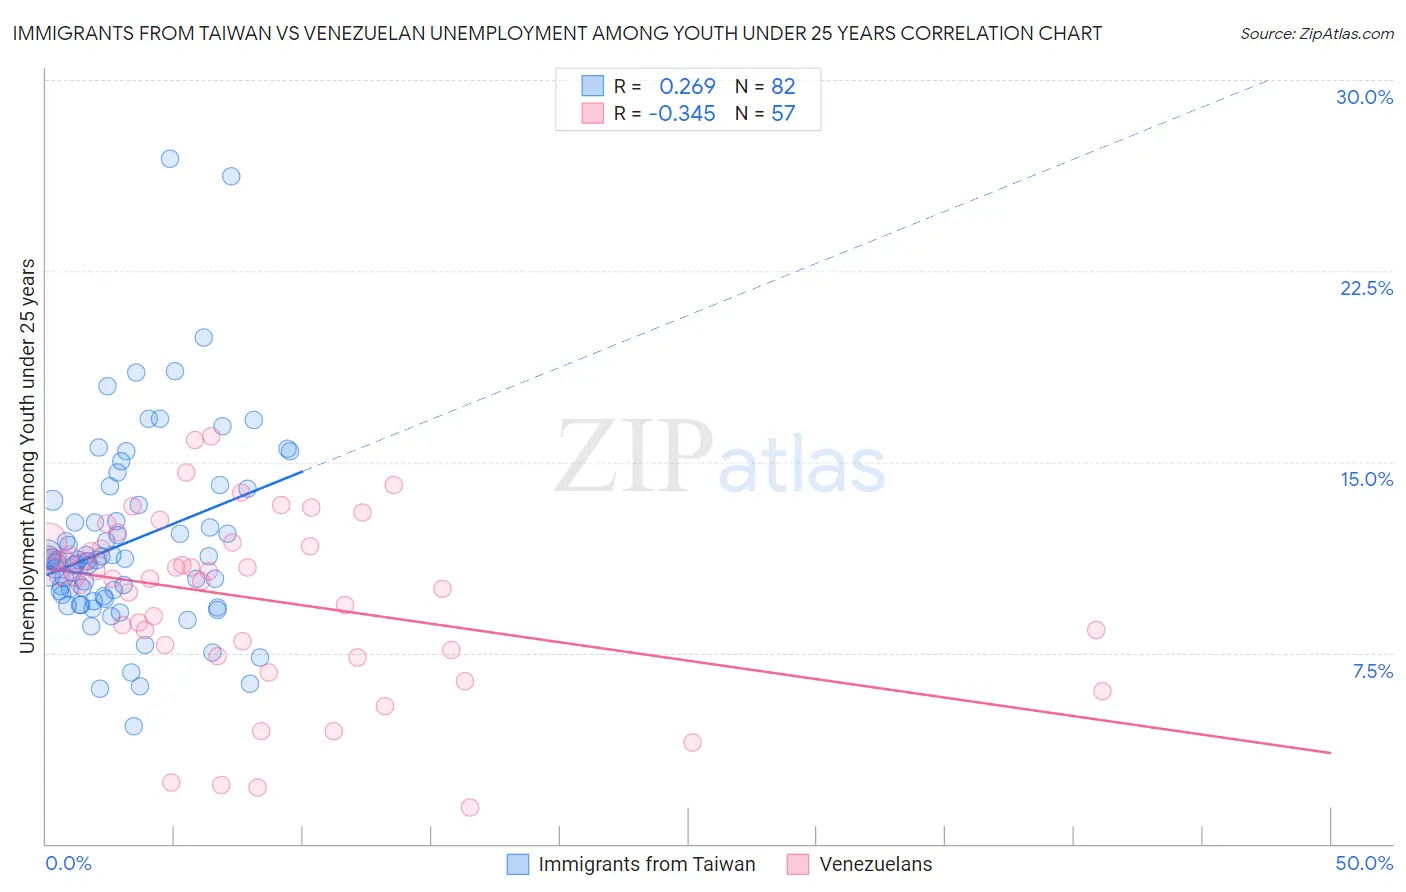
Immigrants from Taiwan vs Venezuelan Unemployment Among Youth under 25 years Correlation Chart
The statistical analysis conducted on geographies consisting of 296,148,481 people shows a weak positive correlation between the proportion of Immigrants from Taiwan and unemployment rate among youth under the age of 25 in the United States with a correlation coefficient (R) of 0.269 and weighted average of 11.2%. Similarly, the statistical analysis conducted on geographies consisting of 304,160,206 people shows a mild negative correlation between the proportion of Venezuelans and unemployment rate among youth under the age of 25 in the United States with a correlation coefficient (R) of -0.345 and weighted average of 10.6%, a difference of 6.4%.
Unemployment Among Youth under 25 years Correlation Summary
| Measurement | Immigrants from Taiwan | Venezuelan |
| Minimum | 4.6% | 1.4% |
| Maximum | 26.9% | 16.0% |
| Range | 22.3% | 14.6% |
| Mean | 11.9% | 9.7% |
| Median | 11.1% | 10.5% |
| Interquartile 25% (IQ1) | 9.7% | 7.7% |
| Interquartile 75% (IQ3) | 13.3% | 11.8% |
| Interquartile Range (IQR) | 3.6% | 4.1% |
| Standard Deviation (Sample) | 3.8% | 3.4% |
| Standard Deviation (Population) | 3.8% | 3.4% |
Similar Demographics by Unemployment Among Youth under 25 years
Demographics Similar to Immigrants from Taiwan by Unemployment Among Youth under 25 years
In terms of unemployment among youth under 25 years, the demographic groups most similar to Immigrants from Taiwan are Immigrants from Latvia (11.2%, a difference of 0.0%), Immigrants from North America (11.2%, a difference of 0.0%), Lithuanian (11.3%, a difference of 0.070%), Immigrants from Bolivia (11.2%, a difference of 0.080%), and Immigrants from Japan (11.2%, a difference of 0.090%).
| Demographics | Rating | Rank | Unemployment Among Youth under 25 years |
| French Canadians | 95.9 /100 | #84 | Exceptional 11.2% |
| Immigrants | South Central Asia | 95.9 /100 | #85 | Exceptional 11.2% |
| Immigrants | South Africa | 95.8 /100 | #86 | Exceptional 11.2% |
| Kenyans | 95.7 /100 | #87 | Exceptional 11.2% |
| Austrians | 95.5 /100 | #88 | Exceptional 11.2% |
| Immigrants | Japan | 95.5 /100 | #89 | Exceptional 11.2% |
| Immigrants | Bolivia | 95.5 /100 | #90 | Exceptional 11.2% |
| Immigrants | Taiwan | 95.1 /100 | #91 | Exceptional 11.2% |
| Immigrants | Latvia | 95.1 /100 | #92 | Exceptional 11.2% |
| Immigrants | North America | 95.1 /100 | #93 | Exceptional 11.2% |
| Lithuanians | 94.8 /100 | #94 | Exceptional 11.3% |
| Carpatho Rusyns | 94.4 /100 | #95 | Exceptional 11.3% |
| Immigrants | Serbia | 94.4 /100 | #96 | Exceptional 11.3% |
| Nicaraguans | 94.3 /100 | #97 | Exceptional 11.3% |
| Estonians | 94.2 /100 | #98 | Exceptional 11.3% |
Demographics Similar to Venezuelans by Unemployment Among Youth under 25 years
In terms of unemployment among youth under 25 years, the demographic groups most similar to Venezuelans are Sudanese (10.6%, a difference of 0.010%), Menominee (10.6%, a difference of 0.050%), Cuban (10.6%, a difference of 0.12%), Indonesian (10.6%, a difference of 0.14%), and Swiss (10.6%, a difference of 0.20%).
| Demographics | Rating | Rank | Unemployment Among Youth under 25 years |
| Germans | 100.0 /100 | #9 | Exceptional 10.5% |
| Immigrants | Somalia | 100.0 /100 | #10 | Exceptional 10.5% |
| Scandinavians | 100.0 /100 | #11 | Exceptional 10.5% |
| Immigrants | Sudan | 100.0 /100 | #12 | Exceptional 10.5% |
| Indonesians | 100.0 /100 | #13 | Exceptional 10.6% |
| Cubans | 100.0 /100 | #14 | Exceptional 10.6% |
| Sudanese | 100.0 /100 | #15 | Exceptional 10.6% |
| Venezuelans | 100.0 /100 | #16 | Exceptional 10.6% |
| Menominee | 100.0 /100 | #17 | Exceptional 10.6% |
| Swiss | 100.0 /100 | #18 | Exceptional 10.6% |
| Immigrants | Burma/Myanmar | 100.0 /100 | #19 | Exceptional 10.6% |
| Dutch | 100.0 /100 | #20 | Exceptional 10.6% |
| Pennsylvania Germans | 100.0 /100 | #21 | Exceptional 10.6% |
| Belgians | 100.0 /100 | #22 | Exceptional 10.6% |
| Immigrants | Bosnia and Herzegovina | 100.0 /100 | #23 | Exceptional 10.6% |