Central American Indian vs Lebanese Unemployment Among Ages 35 to 44 years
COMPARE
Central American Indian
Lebanese
Unemployment Among Ages 35 to 44 years
Unemployment Among Ages 35 to 44 years Comparison
Central American Indians
Lebanese
5.6%
UNEMPLOYMENT AMONG AGES 35 TO 44 YEARS
0.0/ 100
METRIC RATING
293rd/ 347
METRIC RANK
4.7%
UNEMPLOYMENT AMONG AGES 35 TO 44 YEARS
51.4/ 100
METRIC RATING
172nd/ 347
METRIC RANK
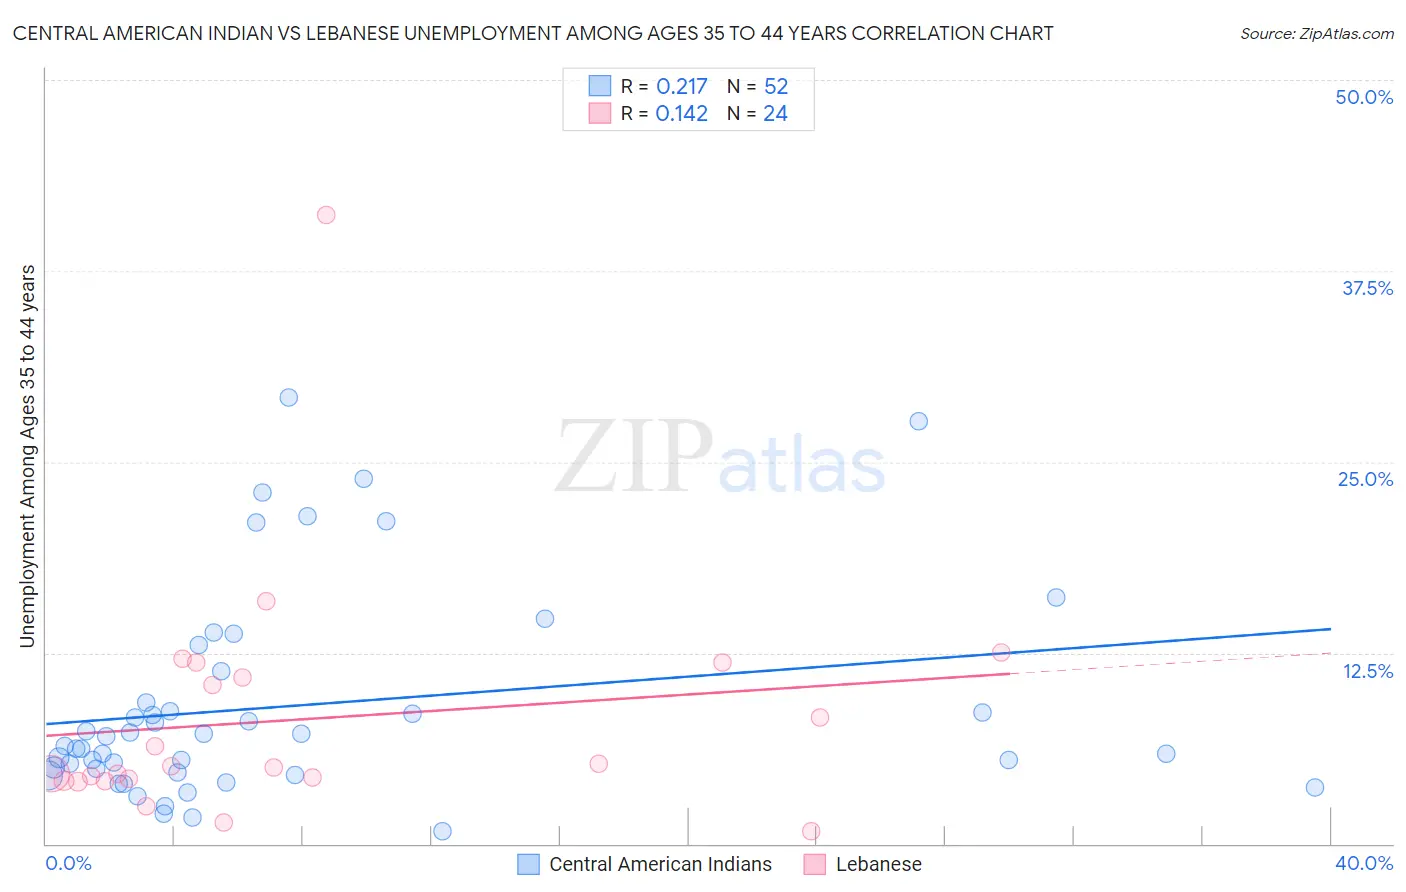
Central American Indian vs Lebanese Unemployment Among Ages 35 to 44 years Correlation Chart
The statistical analysis conducted on geographies consisting of 322,264,951 people shows a weak positive correlation between the proportion of Central American Indians and unemployment rate among population between the ages 35 and 44 in the United States with a correlation coefficient (R) of 0.217 and weighted average of 5.6%. Similarly, the statistical analysis conducted on geographies consisting of 391,592,088 people shows a poor positive correlation between the proportion of Lebanese and unemployment rate among population between the ages 35 and 44 in the United States with a correlation coefficient (R) of 0.142 and weighted average of 4.7%, a difference of 18.6%.
Unemployment Among Ages 35 to 44 years Correlation Summary
| Measurement | Central American Indian | Lebanese |
| Minimum | 0.80% | 0.80% |
| Maximum | 29.2% | 41.2% |
| Range | 28.4% | 40.4% |
| Mean | 9.0% | 8.2% |
| Median | 6.7% | 5.0% |
| Interquartile 25% (IQ1) | 4.8% | 4.2% |
| Interquartile 75% (IQ3) | 10.3% | 11.4% |
| Interquartile Range (IQR) | 5.4% | 7.2% |
| Standard Deviation (Sample) | 6.8% | 8.1% |
| Standard Deviation (Population) | 6.8% | 7.9% |
Similar Demographics by Unemployment Among Ages 35 to 44 years
Demographics Similar to Central American Indians by Unemployment Among Ages 35 to 44 years
In terms of unemployment among ages 35 to 44 years, the demographic groups most similar to Central American Indians are Trinidadian and Tobagonian (5.6%, a difference of 0.010%), Immigrants from Haiti (5.5%, a difference of 0.23%), Ottawa (5.6%, a difference of 0.23%), Immigrants from Trinidad and Tobago (5.6%, a difference of 0.24%), and U.S. Virgin Islander (5.6%, a difference of 0.35%).
| Demographics | Rating | Rank | Unemployment Among Ages 35 to 44 years |
| Immigrants | Micronesia | 0.0 /100 | #286 | Tragic 5.5% |
| French American Indians | 0.0 /100 | #287 | Tragic 5.5% |
| Cree | 0.0 /100 | #288 | Tragic 5.5% |
| Spanish American Indians | 0.0 /100 | #289 | Tragic 5.5% |
| Jamaicans | 0.0 /100 | #290 | Tragic 5.5% |
| Dutch West Indians | 0.0 /100 | #291 | Tragic 5.5% |
| Immigrants | Haiti | 0.0 /100 | #292 | Tragic 5.5% |
| Central American Indians | 0.0 /100 | #293 | Tragic 5.6% |
| Trinidadians and Tobagonians | 0.0 /100 | #294 | Tragic 5.6% |
| Ottawa | 0.0 /100 | #295 | Tragic 5.6% |
| Immigrants | Trinidad and Tobago | 0.0 /100 | #296 | Tragic 5.6% |
| U.S. Virgin Islanders | 0.0 /100 | #297 | Tragic 5.6% |
| Aleuts | 0.0 /100 | #298 | Tragic 5.6% |
| Immigrants | Jamaica | 0.0 /100 | #299 | Tragic 5.6% |
| Immigrants | West Indies | 0.0 /100 | #300 | Tragic 5.6% |
Demographics Similar to Lebanese by Unemployment Among Ages 35 to 44 years
In terms of unemployment among ages 35 to 44 years, the demographic groups most similar to Lebanese are Indonesian (4.7%, a difference of 0.020%), Iraqi (4.7%, a difference of 0.040%), Immigrants from Indonesia (4.7%, a difference of 0.090%), Afghan (4.7%, a difference of 0.10%), and Pennsylvania German (4.7%, a difference of 0.12%).
| Demographics | Rating | Rank | Unemployment Among Ages 35 to 44 years |
| German Russians | 57.2 /100 | #165 | Average 4.7% |
| French | 55.6 /100 | #166 | Average 4.7% |
| Peruvians | 54.4 /100 | #167 | Average 4.7% |
| Arabs | 53.1 /100 | #168 | Average 4.7% |
| Pennsylvania Germans | 53.0 /100 | #169 | Average 4.7% |
| Immigrants | Indonesia | 52.6 /100 | #170 | Average 4.7% |
| Indonesians | 51.7 /100 | #171 | Average 4.7% |
| Lebanese | 51.4 /100 | #172 | Average 4.7% |
| Iraqis | 50.9 /100 | #173 | Average 4.7% |
| Afghans | 50.0 /100 | #174 | Average 4.7% |
| Immigrants | Germany | 48.9 /100 | #175 | Average 4.7% |
| Immigrants | Uganda | 48.1 /100 | #176 | Average 4.7% |
| Slovaks | 44.6 /100 | #177 | Average 4.7% |
| South American Indians | 40.7 /100 | #178 | Average 4.7% |
| Immigrants | South Eastern Asia | 40.2 /100 | #179 | Average 4.7% |