Swiss vs Immigrants from Zimbabwe Male Unemployment
COMPARE
Swiss
Immigrants from Zimbabwe
Male Unemployment
Male Unemployment Comparison
Swiss
Immigrants from Zimbabwe
4.7%
MALE UNEMPLOYMENT
99.9/ 100
METRIC RATING
16th/ 347
METRIC RANK
4.9%
MALE UNEMPLOYMENT
99.0/ 100
METRIC RATING
45th/ 347
METRIC RANK
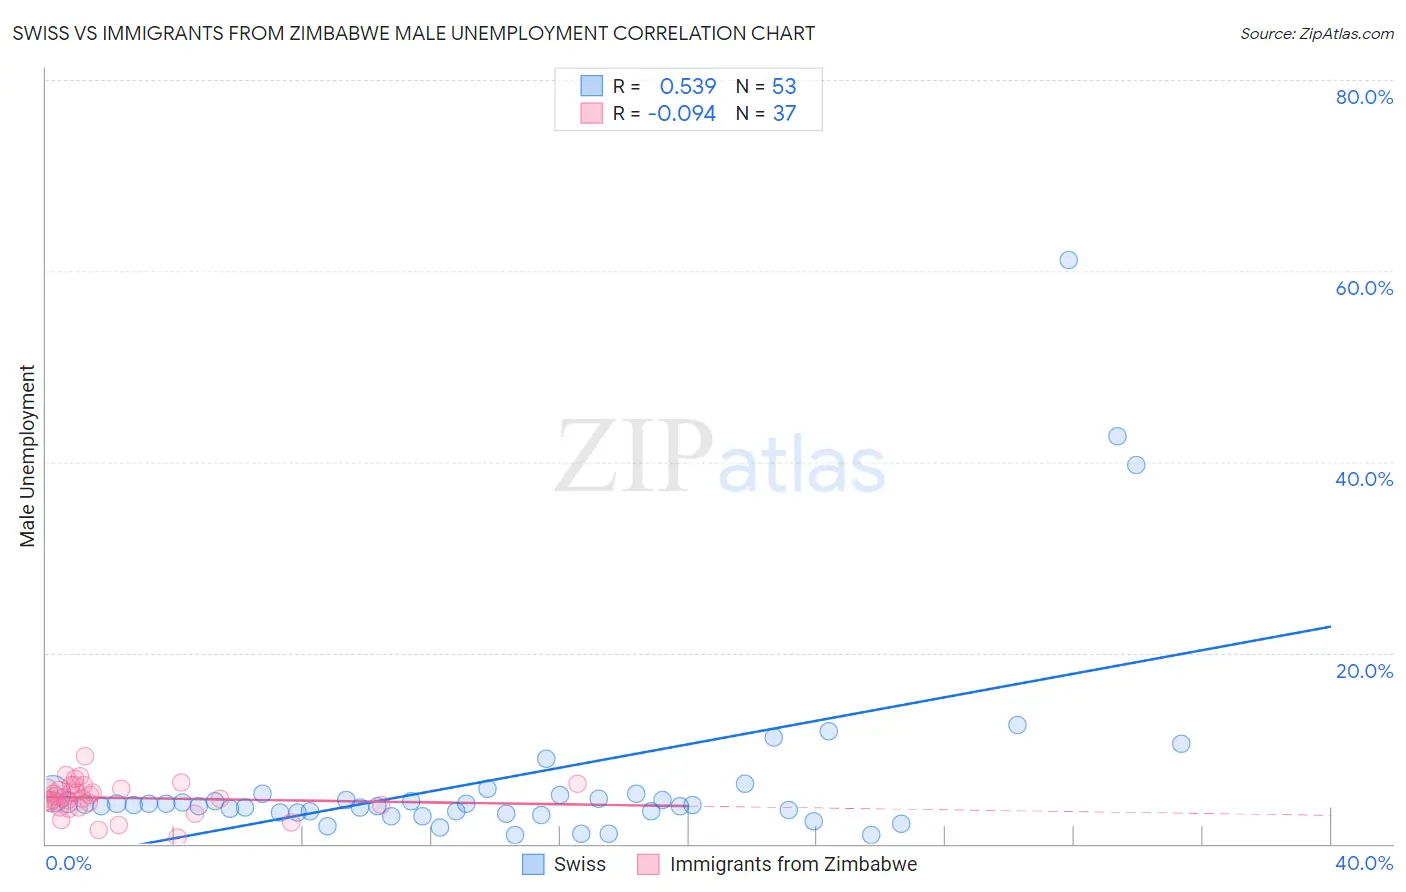
Swiss vs Immigrants from Zimbabwe Male Unemployment Correlation Chart
The statistical analysis conducted on geographies consisting of 460,477,657 people shows a substantial positive correlation between the proportion of Swiss and unemployment rate among males in the United States with a correlation coefficient (R) of 0.539 and weighted average of 4.7%. Similarly, the statistical analysis conducted on geographies consisting of 117,685,167 people shows a slight negative correlation between the proportion of Immigrants from Zimbabwe and unemployment rate among males in the United States with a correlation coefficient (R) of -0.094 and weighted average of 4.9%, a difference of 4.9%.
Male Unemployment Correlation Summary
| Measurement | Swiss | Immigrants from Zimbabwe |
| Minimum | 0.90% | 0.60% |
| Maximum | 61.1% | 9.1% |
| Range | 60.2% | 8.5% |
| Mean | 6.9% | 4.8% |
| Median | 4.1% | 4.8% |
| Interquartile 25% (IQ1) | 3.3% | 4.0% |
| Interquartile 75% (IQ3) | 5.2% | 5.9% |
| Interquartile Range (IQR) | 1.8% | 1.9% |
| Standard Deviation (Sample) | 10.7% | 1.7% |
| Standard Deviation (Population) | 10.6% | 1.7% |
Similar Demographics by Male Unemployment
Demographics Similar to Swiss by Male Unemployment
In terms of male unemployment, the demographic groups most similar to Swiss are Scandinavian (4.7%, a difference of 0.050%), German (4.7%, a difference of 0.32%), Bolivian (4.7%, a difference of 0.34%), Filipino (4.7%, a difference of 0.73%), and Immigrants from Bolivia (4.7%, a difference of 1.0%).
| Demographics | Rating | Rank | Male Unemployment |
| Thais | 100.0 /100 | #9 | Exceptional 4.6% |
| Cubans | 100.0 /100 | #10 | Exceptional 4.6% |
| Swedes | 100.0 /100 | #11 | Exceptional 4.6% |
| Immigrants | Bolivia | 100.0 /100 | #12 | Exceptional 4.7% |
| Bolivians | 100.0 /100 | #13 | Exceptional 4.7% |
| Germans | 100.0 /100 | #14 | Exceptional 4.7% |
| Scandinavians | 100.0 /100 | #15 | Exceptional 4.7% |
| Swiss | 99.9 /100 | #16 | Exceptional 4.7% |
| Filipinos | 99.9 /100 | #17 | Exceptional 4.7% |
| English | 99.9 /100 | #18 | Exceptional 4.8% |
| Europeans | 99.9 /100 | #19 | Exceptional 4.8% |
| Pennsylvania Germans | 99.9 /100 | #20 | Exceptional 4.8% |
| Immigrants | Taiwan | 99.9 /100 | #21 | Exceptional 4.8% |
| Carpatho Rusyns | 99.9 /100 | #22 | Exceptional 4.8% |
| Tongans | 99.9 /100 | #23 | Exceptional 4.8% |
Demographics Similar to Immigrants from Zimbabwe by Male Unemployment
In terms of male unemployment, the demographic groups most similar to Immigrants from Zimbabwe are Bhutanese (4.9%, a difference of 0.090%), Immigrants from Korea (4.9%, a difference of 0.15%), Austrian (4.9%, a difference of 0.16%), Immigrants from Scotland (4.9%, a difference of 0.18%), and Polish (4.9%, a difference of 0.19%).
| Demographics | Rating | Rank | Male Unemployment |
| Immigrants | Bosnia and Herzegovina | 99.4 /100 | #38 | Exceptional 4.9% |
| Burmese | 99.3 /100 | #39 | Exceptional 4.9% |
| Northern Europeans | 99.3 /100 | #40 | Exceptional 4.9% |
| Chinese | 99.3 /100 | #41 | Exceptional 4.9% |
| Immigrants | Belgium | 99.2 /100 | #42 | Exceptional 4.9% |
| Immigrants | Japan | 99.2 /100 | #43 | Exceptional 4.9% |
| Immigrants | Korea | 99.1 /100 | #44 | Exceptional 4.9% |
| Immigrants | Zimbabwe | 99.0 /100 | #45 | Exceptional 4.9% |
| Bhutanese | 98.9 /100 | #46 | Exceptional 4.9% |
| Austrians | 98.9 /100 | #47 | Exceptional 4.9% |
| Immigrants | Scotland | 98.9 /100 | #48 | Exceptional 4.9% |
| Poles | 98.9 /100 | #49 | Exceptional 4.9% |
| Croatians | 98.9 /100 | #50 | Exceptional 4.9% |
| Slovenes | 98.8 /100 | #51 | Exceptional 5.0% |
| Irish | 98.8 /100 | #52 | Exceptional 5.0% |