Swiss vs Immigrants from Italy Male Unemployment
COMPARE
Swiss
Immigrants from Italy
Male Unemployment
Male Unemployment Comparison
Swiss
Immigrants from Italy
4.7%
MALE UNEMPLOYMENT
99.9/ 100
METRIC RATING
16th/ 347
METRIC RANK
5.2%
MALE UNEMPLOYMENT
76.3/ 100
METRIC RATING
148th/ 347
METRIC RANK
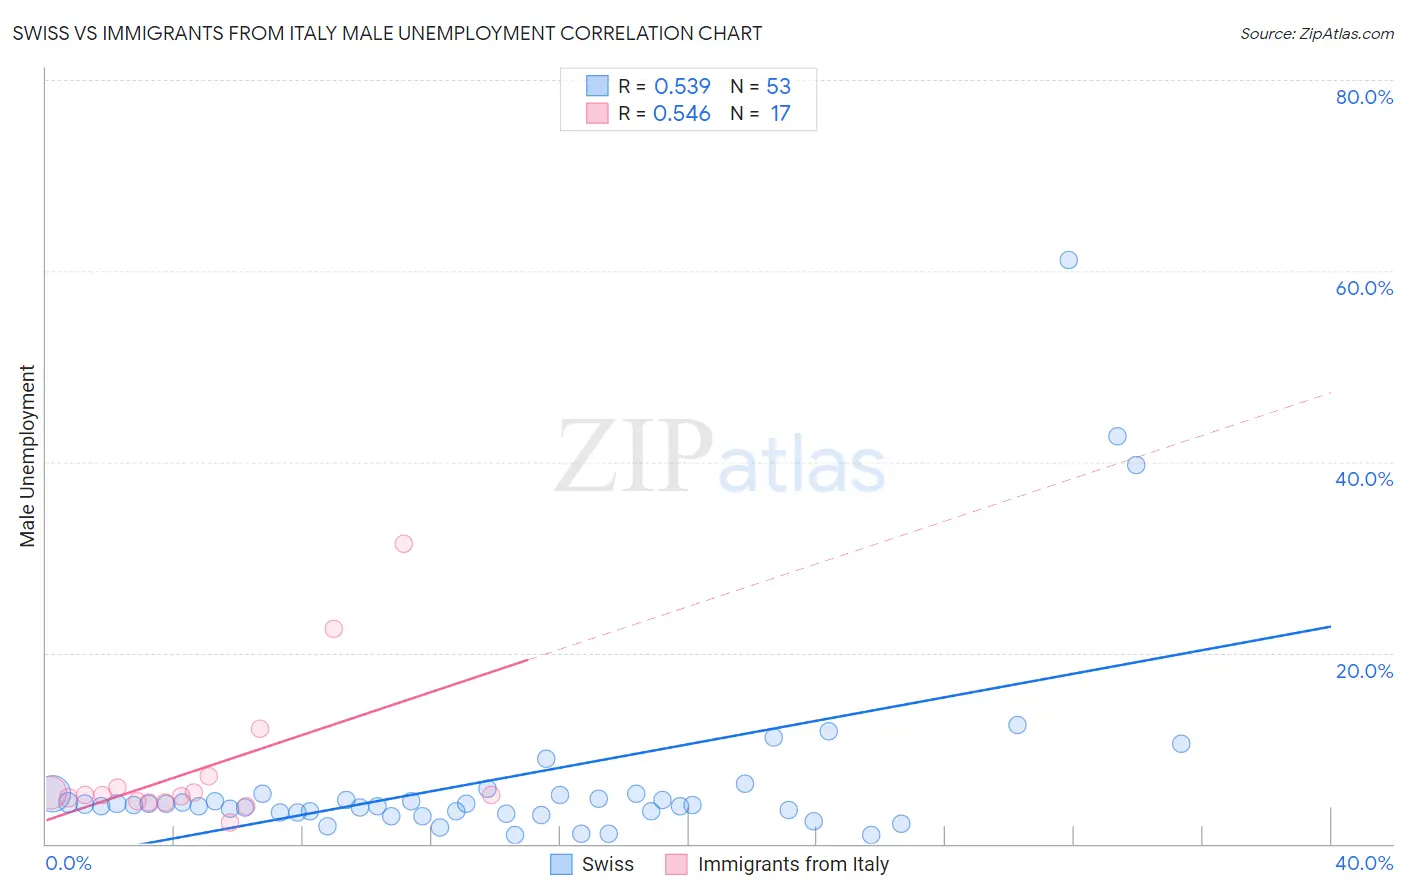
Swiss vs Immigrants from Italy Male Unemployment Correlation Chart
The statistical analysis conducted on geographies consisting of 460,477,657 people shows a substantial positive correlation between the proportion of Swiss and unemployment rate among males in the United States with a correlation coefficient (R) of 0.539 and weighted average of 4.7%. Similarly, the statistical analysis conducted on geographies consisting of 323,258,281 people shows a substantial positive correlation between the proportion of Immigrants from Italy and unemployment rate among males in the United States with a correlation coefficient (R) of 0.546 and weighted average of 5.2%, a difference of 10.5%.
Male Unemployment Correlation Summary
| Measurement | Swiss | Immigrants from Italy |
| Minimum | 0.90% | 2.2% |
| Maximum | 61.1% | 31.4% |
| Range | 60.2% | 29.2% |
| Mean | 6.9% | 7.9% |
| Median | 4.1% | 5.1% |
| Interquartile 25% (IQ1) | 3.3% | 4.4% |
| Interquartile 75% (IQ3) | 5.2% | 6.5% |
| Interquartile Range (IQR) | 1.8% | 2.1% |
| Standard Deviation (Sample) | 10.7% | 7.6% |
| Standard Deviation (Population) | 10.6% | 7.4% |
Similar Demographics by Male Unemployment
Demographics Similar to Swiss by Male Unemployment
In terms of male unemployment, the demographic groups most similar to Swiss are Scandinavian (4.7%, a difference of 0.050%), German (4.7%, a difference of 0.32%), Bolivian (4.7%, a difference of 0.34%), Filipino (4.7%, a difference of 0.73%), and Immigrants from Bolivia (4.7%, a difference of 1.0%).
| Demographics | Rating | Rank | Male Unemployment |
| Thais | 100.0 /100 | #9 | Exceptional 4.6% |
| Cubans | 100.0 /100 | #10 | Exceptional 4.6% |
| Swedes | 100.0 /100 | #11 | Exceptional 4.6% |
| Immigrants | Bolivia | 100.0 /100 | #12 | Exceptional 4.7% |
| Bolivians | 100.0 /100 | #13 | Exceptional 4.7% |
| Germans | 100.0 /100 | #14 | Exceptional 4.7% |
| Scandinavians | 100.0 /100 | #15 | Exceptional 4.7% |
| Swiss | 99.9 /100 | #16 | Exceptional 4.7% |
| Filipinos | 99.9 /100 | #17 | Exceptional 4.7% |
| English | 99.9 /100 | #18 | Exceptional 4.8% |
| Europeans | 99.9 /100 | #19 | Exceptional 4.8% |
| Pennsylvania Germans | 99.9 /100 | #20 | Exceptional 4.8% |
| Immigrants | Taiwan | 99.9 /100 | #21 | Exceptional 4.8% |
| Carpatho Rusyns | 99.9 /100 | #22 | Exceptional 4.8% |
| Tongans | 99.9 /100 | #23 | Exceptional 4.8% |
Demographics Similar to Immigrants from Italy by Male Unemployment
In terms of male unemployment, the demographic groups most similar to Immigrants from Italy are Immigrants from Europe (5.2%, a difference of 0.010%), Indian (Asian) (5.2%, a difference of 0.030%), Slovak (5.2%, a difference of 0.060%), Immigrants from Burma/Myanmar (5.2%, a difference of 0.10%), and Immigrants from Kenya (5.2%, a difference of 0.11%).
| Demographics | Rating | Rank | Male Unemployment |
| Immigrants | Switzerland | 79.2 /100 | #141 | Good 5.2% |
| Fijians | 78.3 /100 | #142 | Good 5.2% |
| Syrians | 78.0 /100 | #143 | Good 5.2% |
| Sri Lankans | 77.9 /100 | #144 | Good 5.2% |
| Macedonians | 77.7 /100 | #145 | Good 5.2% |
| Immigrants | Kenya | 77.6 /100 | #146 | Good 5.2% |
| Immigrants | Burma/Myanmar | 77.5 /100 | #147 | Good 5.2% |
| Immigrants | Italy | 76.3 /100 | #148 | Good 5.2% |
| Immigrants | Europe | 76.2 /100 | #149 | Good 5.2% |
| Indians (Asian) | 76.0 /100 | #150 | Good 5.2% |
| Slovaks | 75.5 /100 | #151 | Good 5.2% |
| Egyptians | 74.8 /100 | #152 | Good 5.2% |
| Immigrants | Uruguay | 73.9 /100 | #153 | Good 5.2% |
| Laotians | 73.8 /100 | #154 | Good 5.2% |
| Immigrants | Hungary | 73.4 /100 | #155 | Good 5.2% |