Immigrants from Honduras vs Immigrants from Italy Male Unemployment
COMPARE
Immigrants from Honduras
Immigrants from Italy
Male Unemployment
Male Unemployment Comparison
Immigrants from Honduras
Immigrants from Italy
5.6%
MALE UNEMPLOYMENT
1.5/ 100
METRIC RATING
235th/ 347
METRIC RANK
5.2%
MALE UNEMPLOYMENT
76.3/ 100
METRIC RATING
148th/ 347
METRIC RANK
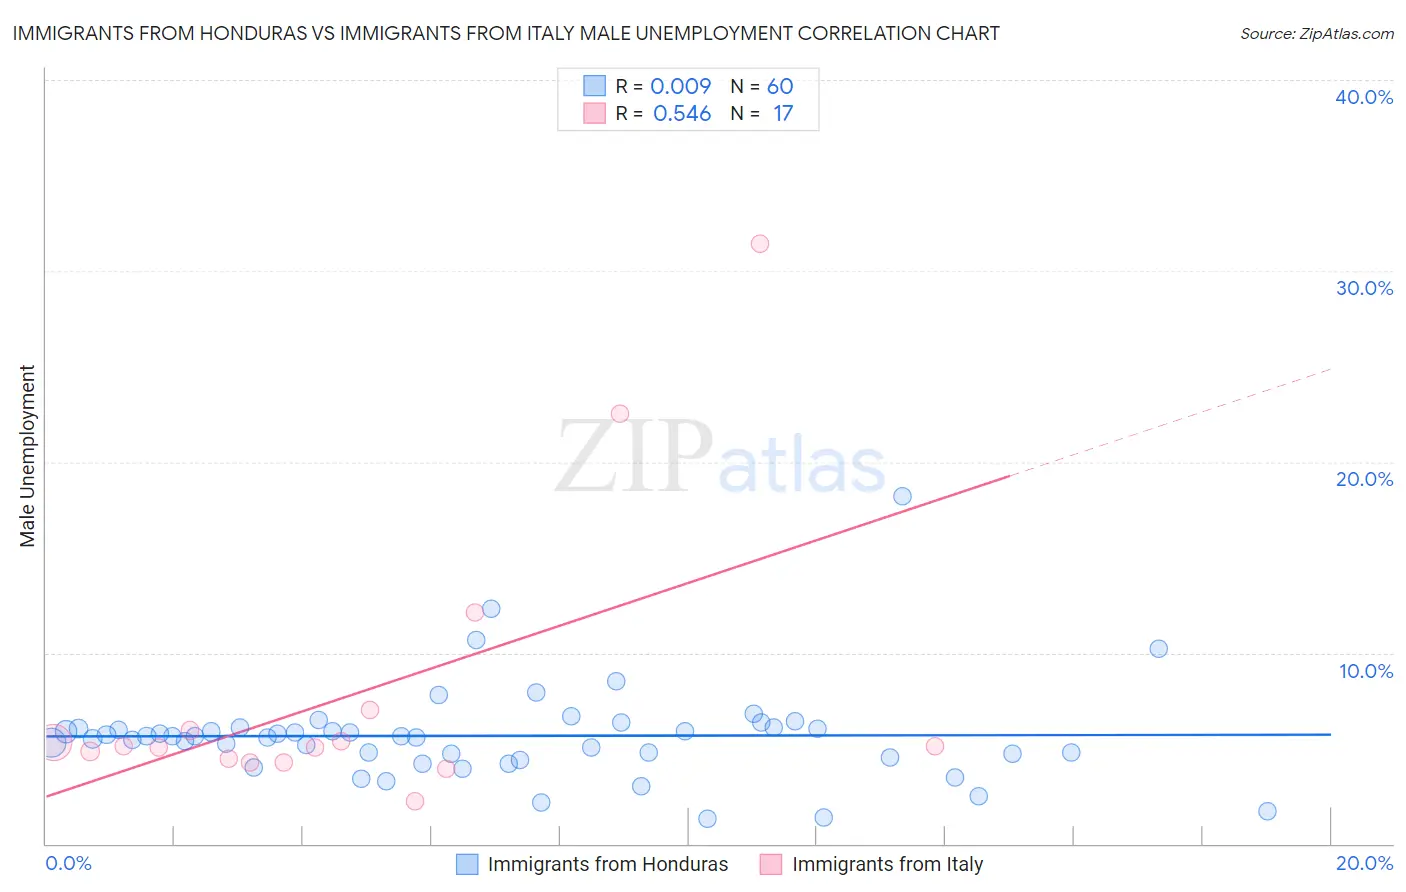
Immigrants from Honduras vs Immigrants from Italy Male Unemployment Correlation Chart
The statistical analysis conducted on geographies consisting of 321,727,023 people shows no correlation between the proportion of Immigrants from Honduras and unemployment rate among males in the United States with a correlation coefficient (R) of 0.009 and weighted average of 5.6%. Similarly, the statistical analysis conducted on geographies consisting of 323,258,281 people shows a substantial positive correlation between the proportion of Immigrants from Italy and unemployment rate among males in the United States with a correlation coefficient (R) of 0.546 and weighted average of 5.2%, a difference of 8.0%.
Male Unemployment Correlation Summary
| Measurement | Immigrants from Honduras | Immigrants from Italy |
| Minimum | 1.3% | 2.2% |
| Maximum | 18.2% | 31.4% |
| Range | 16.9% | 29.2% |
| Mean | 5.7% | 7.9% |
| Median | 5.6% | 5.1% |
| Interquartile 25% (IQ1) | 4.6% | 4.4% |
| Interquartile 75% (IQ3) | 6.1% | 6.5% |
| Interquartile Range (IQR) | 1.5% | 2.1% |
| Standard Deviation (Sample) | 2.6% | 7.6% |
| Standard Deviation (Population) | 2.5% | 7.4% |
Similar Demographics by Male Unemployment
Demographics Similar to Immigrants from Honduras by Male Unemployment
In terms of male unemployment, the demographic groups most similar to Immigrants from Honduras are Somali (5.6%, a difference of 0.030%), Immigrants from Somalia (5.6%, a difference of 0.030%), Moroccan (5.6%, a difference of 0.11%), Choctaw (5.6%, a difference of 0.14%), and Immigrants from Africa (5.6%, a difference of 0.19%).
| Demographics | Rating | Rank | Male Unemployment |
| Seminole | 1.8 /100 | #228 | Tragic 5.6% |
| Central Americans | 1.8 /100 | #229 | Tragic 5.6% |
| Immigrants | Africa | 1.7 /100 | #230 | Tragic 5.6% |
| Choctaw | 1.6 /100 | #231 | Tragic 5.6% |
| Moroccans | 1.6 /100 | #232 | Tragic 5.6% |
| Somalis | 1.5 /100 | #233 | Tragic 5.6% |
| Immigrants | Somalia | 1.5 /100 | #234 | Tragic 5.6% |
| Immigrants | Honduras | 1.5 /100 | #235 | Tragic 5.6% |
| Guatemalans | 1.2 /100 | #236 | Tragic 5.6% |
| Hondurans | 1.1 /100 | #237 | Tragic 5.6% |
| Native Hawaiians | 1.1 /100 | #238 | Tragic 5.6% |
| Immigrants | Guatemala | 1.1 /100 | #239 | Tragic 5.6% |
| Immigrants | Cameroon | 1.0 /100 | #240 | Tragic 5.6% |
| Salvadorans | 1.0 /100 | #241 | Tragic 5.7% |
| Ottawa | 0.9 /100 | #242 | Tragic 5.7% |
Demographics Similar to Immigrants from Italy by Male Unemployment
In terms of male unemployment, the demographic groups most similar to Immigrants from Italy are Immigrants from Europe (5.2%, a difference of 0.010%), Indian (Asian) (5.2%, a difference of 0.030%), Slovak (5.2%, a difference of 0.060%), Immigrants from Burma/Myanmar (5.2%, a difference of 0.10%), and Immigrants from Kenya (5.2%, a difference of 0.11%).
| Demographics | Rating | Rank | Male Unemployment |
| Immigrants | Switzerland | 79.2 /100 | #141 | Good 5.2% |
| Fijians | 78.3 /100 | #142 | Good 5.2% |
| Syrians | 78.0 /100 | #143 | Good 5.2% |
| Sri Lankans | 77.9 /100 | #144 | Good 5.2% |
| Macedonians | 77.7 /100 | #145 | Good 5.2% |
| Immigrants | Kenya | 77.6 /100 | #146 | Good 5.2% |
| Immigrants | Burma/Myanmar | 77.5 /100 | #147 | Good 5.2% |
| Immigrants | Italy | 76.3 /100 | #148 | Good 5.2% |
| Immigrants | Europe | 76.2 /100 | #149 | Good 5.2% |
| Indians (Asian) | 76.0 /100 | #150 | Good 5.2% |
| Slovaks | 75.5 /100 | #151 | Good 5.2% |
| Egyptians | 74.8 /100 | #152 | Good 5.2% |
| Immigrants | Uruguay | 73.9 /100 | #153 | Good 5.2% |
| Laotians | 73.8 /100 | #154 | Good 5.2% |
| Immigrants | Hungary | 73.4 /100 | #155 | Good 5.2% |