Immigrants from Sweden vs Dutch West Indian Male Unemployment
COMPARE
Immigrants from Sweden
Dutch West Indian
Male Unemployment
Male Unemployment Comparison
Immigrants from Sweden
Dutch West Indians
5.0%
MALE UNEMPLOYMENT
97.4/ 100
METRIC RATING
69th/ 347
METRIC RANK
5.8%
MALE UNEMPLOYMENT
0.1/ 100
METRIC RATING
258th/ 347
METRIC RANK
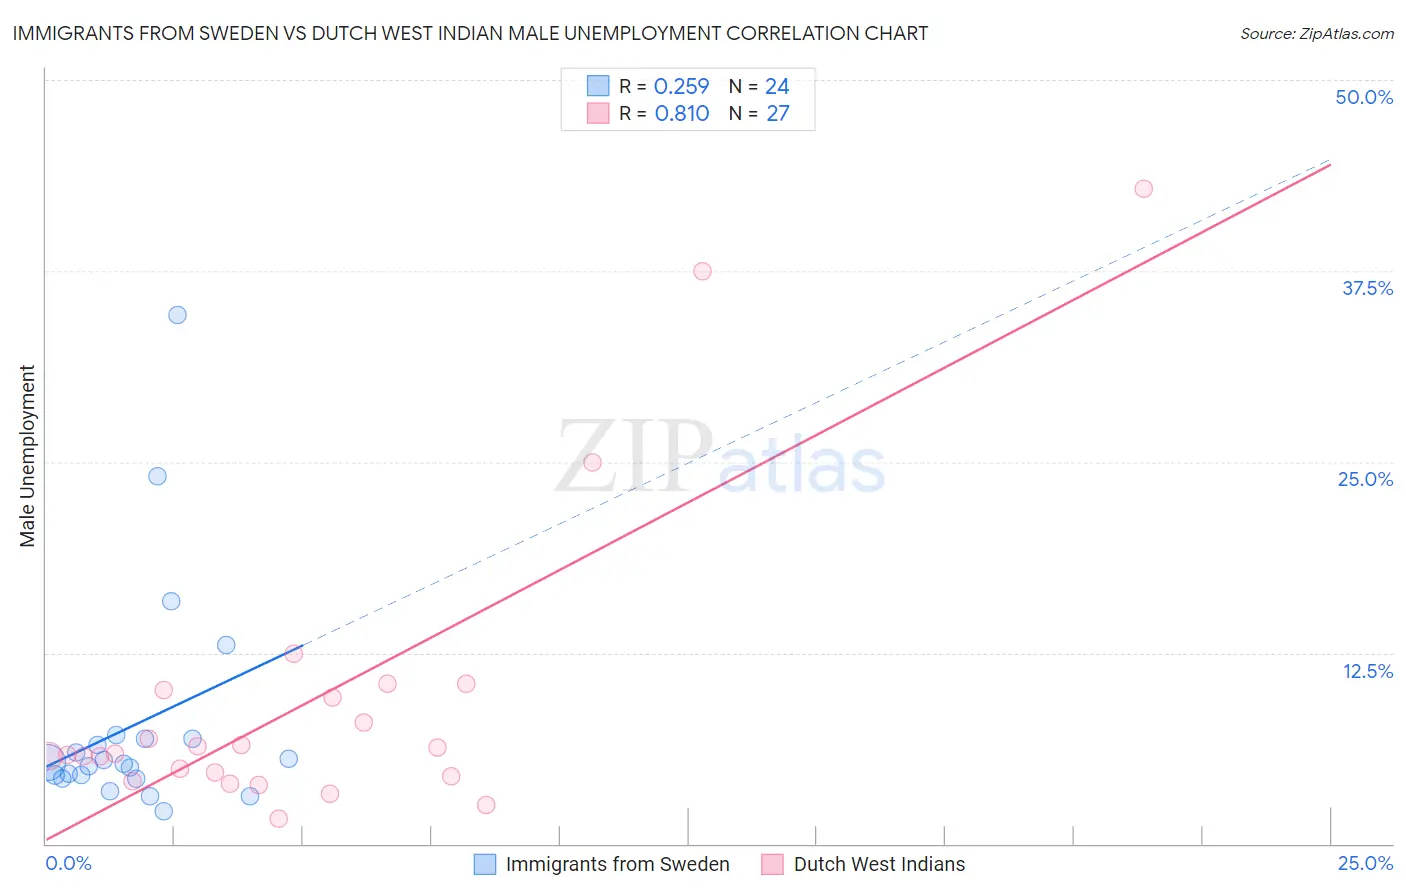
Immigrants from Sweden vs Dutch West Indian Male Unemployment Correlation Chart
The statistical analysis conducted on geographies consisting of 164,513,093 people shows a weak positive correlation between the proportion of Immigrants from Sweden and unemployment rate among males in the United States with a correlation coefficient (R) of 0.259 and weighted average of 5.0%. Similarly, the statistical analysis conducted on geographies consisting of 85,545,191 people shows a very strong positive correlation between the proportion of Dutch West Indians and unemployment rate among males in the United States with a correlation coefficient (R) of 0.810 and weighted average of 5.8%, a difference of 15.9%.
Male Unemployment Correlation Summary
| Measurement | Immigrants from Sweden | Dutch West Indian |
| Minimum | 2.1% | 1.6% |
| Maximum | 34.6% | 42.9% |
| Range | 32.5% | 41.3% |
| Mean | 7.8% | 9.4% |
| Median | 5.3% | 5.9% |
| Interquartile 25% (IQ1) | 4.4% | 4.4% |
| Interquartile 75% (IQ3) | 6.9% | 10.1% |
| Interquartile Range (IQR) | 2.5% | 5.7% |
| Standard Deviation (Sample) | 7.4% | 9.9% |
| Standard Deviation (Population) | 7.3% | 9.8% |
Similar Demographics by Male Unemployment
Demographics Similar to Immigrants from Sweden by Male Unemployment
In terms of male unemployment, the demographic groups most similar to Immigrants from Sweden are Australian (5.0%, a difference of 0.030%), Immigrants from Canada (5.0%, a difference of 0.040%), White/Caucasian (5.0%, a difference of 0.050%), Finnish (5.0%, a difference of 0.060%), and New Zealander (5.0%, a difference of 0.070%).
| Demographics | Rating | Rank | Male Unemployment |
| Basques | 97.9 /100 | #62 | Exceptional 5.0% |
| Eastern Europeans | 97.9 /100 | #63 | Exceptional 5.0% |
| Celtics | 97.8 /100 | #64 | Exceptional 5.0% |
| Icelanders | 97.6 /100 | #65 | Exceptional 5.0% |
| Finns | 97.5 /100 | #66 | Exceptional 5.0% |
| Immigrants | Canada | 97.5 /100 | #67 | Exceptional 5.0% |
| Australians | 97.4 /100 | #68 | Exceptional 5.0% |
| Immigrants | Sweden | 97.4 /100 | #69 | Exceptional 5.0% |
| Whites/Caucasians | 97.3 /100 | #70 | Exceptional 5.0% |
| New Zealanders | 97.3 /100 | #71 | Exceptional 5.0% |
| Immigrants | South Africa | 97.1 /100 | #72 | Exceptional 5.0% |
| Greeks | 97.0 /100 | #73 | Exceptional 5.0% |
| Immigrants | North America | 96.9 /100 | #74 | Exceptional 5.0% |
| Assyrians/Chaldeans/Syriacs | 96.9 /100 | #75 | Exceptional 5.0% |
| Immigrants | Sudan | 96.5 /100 | #76 | Exceptional 5.0% |
Demographics Similar to Dutch West Indians by Male Unemployment
In terms of male unemployment, the demographic groups most similar to Dutch West Indians are Hispanic or Latino (5.8%, a difference of 0.14%), Cajun (5.8%, a difference of 0.15%), Immigrants from Central America (5.8%, a difference of 0.21%), Comanche (5.8%, a difference of 0.30%), and Kiowa (5.8%, a difference of 0.38%).
| Demographics | Rating | Rank | Male Unemployment |
| Spanish Americans | 0.3 /100 | #251 | Tragic 5.7% |
| Mexicans | 0.2 /100 | #252 | Tragic 5.8% |
| Mexican American Indians | 0.2 /100 | #253 | Tragic 5.8% |
| Japanese | 0.2 /100 | #254 | Tragic 5.8% |
| Kiowa | 0.2 /100 | #255 | Tragic 5.8% |
| Comanche | 0.2 /100 | #256 | Tragic 5.8% |
| Hispanics or Latinos | 0.1 /100 | #257 | Tragic 5.8% |
| Dutch West Indians | 0.1 /100 | #258 | Tragic 5.8% |
| Cajuns | 0.1 /100 | #259 | Tragic 5.8% |
| Immigrants | Central America | 0.1 /100 | #260 | Tragic 5.8% |
| Liberians | 0.1 /100 | #261 | Tragic 5.8% |
| Immigrants | Portugal | 0.1 /100 | #262 | Tragic 5.9% |
| Immigrants | Latin America | 0.1 /100 | #263 | Tragic 5.9% |
| Immigrants | Mexico | 0.0 /100 | #264 | Tragic 5.9% |
| French American Indians | 0.0 /100 | #265 | Tragic 5.9% |