Immigrants from West Indies vs Carpatho Rusyn Unemployment Among Seniors over 75 years
COMPARE
Immigrants from West Indies
Carpatho Rusyn
Unemployment Among Seniors over 75 years
Unemployment Among Seniors over 75 years Comparison
Immigrants from West Indies
Carpatho Rusyns
8.3%
UNEMPLOYMENT AMONG SENIORS OVER 75 YEARS
98.1/ 100
METRIC RATING
116th/ 347
METRIC RANK
9.7%
UNEMPLOYMENT AMONG SENIORS OVER 75 YEARS
0.0/ 100
METRIC RATING
285th/ 347
METRIC RANK
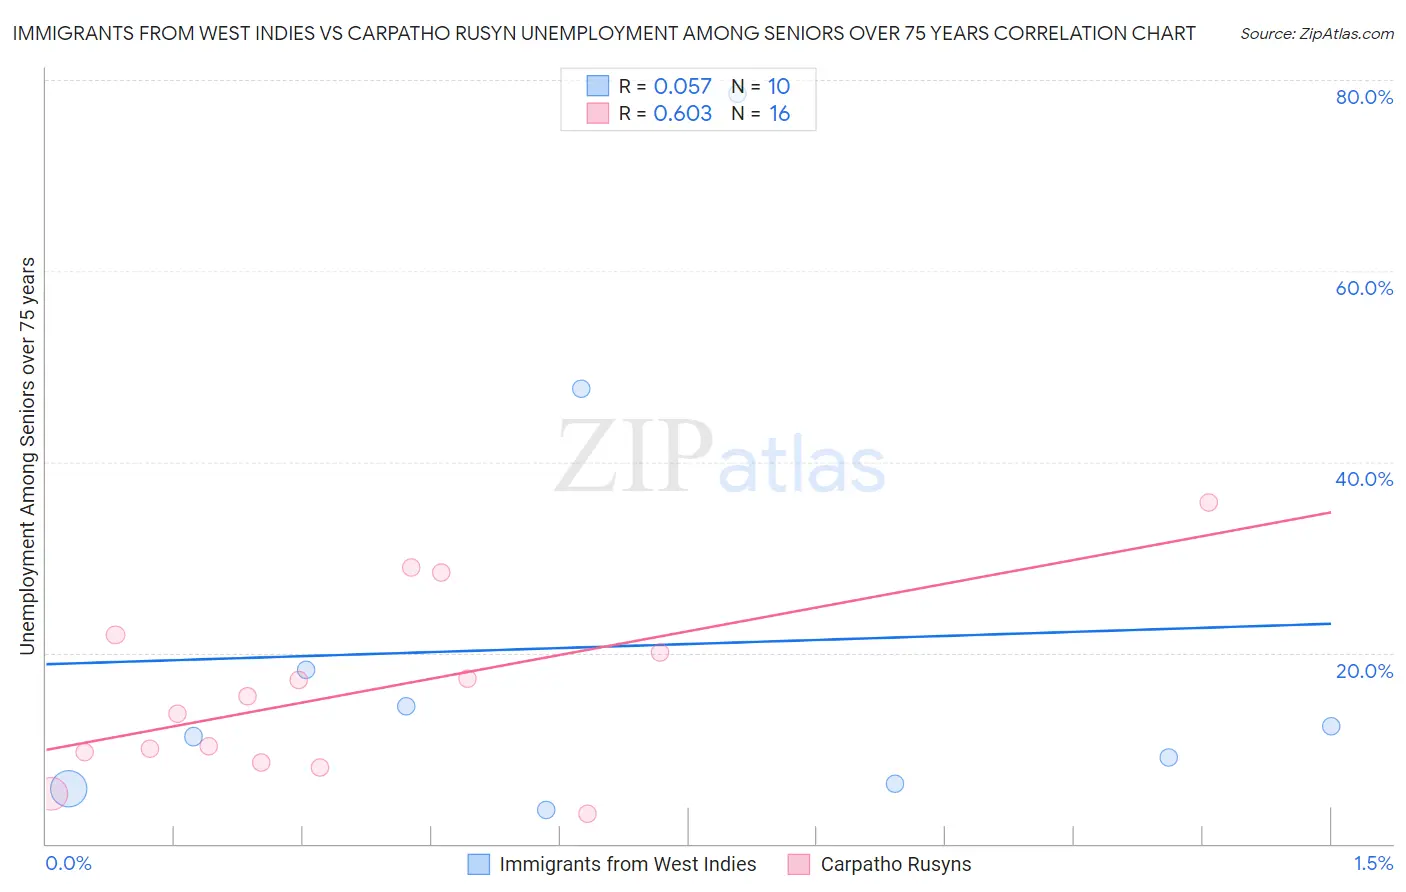
Immigrants from West Indies vs Carpatho Rusyn Unemployment Among Seniors over 75 years Correlation Chart
The statistical analysis conducted on geographies consisting of 57,429,736 people shows a slight positive correlation between the proportion of Immigrants from West Indies and unemployment rate among seniors over the age of 75 in the United States with a correlation coefficient (R) of 0.057 and weighted average of 8.3%. Similarly, the statistical analysis conducted on geographies consisting of 46,670,878 people shows a significant positive correlation between the proportion of Carpatho Rusyns and unemployment rate among seniors over the age of 75 in the United States with a correlation coefficient (R) of 0.603 and weighted average of 9.7%, a difference of 16.7%.
Unemployment Among Seniors over 75 years Correlation Summary
| Measurement | Immigrants from West Indies | Carpatho Rusyn |
| Minimum | 3.5% | 3.1% |
| Maximum | 78.6% | 35.7% |
| Range | 75.1% | 32.6% |
| Mean | 20.7% | 15.8% |
| Median | 11.8% | 14.6% |
| Interquartile 25% (IQ1) | 6.3% | 9.1% |
| Interquartile 75% (IQ3) | 18.2% | 20.9% |
| Interquartile Range (IQR) | 11.9% | 11.9% |
| Standard Deviation (Sample) | 23.9% | 9.2% |
| Standard Deviation (Population) | 22.7% | 9.0% |
Similar Demographics by Unemployment Among Seniors over 75 years
Demographics Similar to Immigrants from West Indies by Unemployment Among Seniors over 75 years
In terms of unemployment among seniors over 75 years, the demographic groups most similar to Immigrants from West Indies are Sudanese (8.3%, a difference of 0.070%), Immigrants from Greece (8.3%, a difference of 0.14%), Immigrants from Middle Africa (8.3%, a difference of 0.18%), Trinidadian and Tobagonian (8.3%, a difference of 0.19%), and Asian (8.3%, a difference of 0.34%).
| Demographics | Rating | Rank | Unemployment Among Seniors over 75 years |
| Immigrants | Lebanon | 98.8 /100 | #109 | Exceptional 8.2% |
| Marshallese | 98.7 /100 | #110 | Exceptional 8.2% |
| French American Indians | 98.7 /100 | #111 | Exceptional 8.2% |
| Immigrants | India | 98.6 /100 | #112 | Exceptional 8.2% |
| Asians | 98.5 /100 | #113 | Exceptional 8.3% |
| Trinidadians and Tobagonians | 98.4 /100 | #114 | Exceptional 8.3% |
| Sudanese | 98.2 /100 | #115 | Exceptional 8.3% |
| Immigrants | West Indies | 98.1 /100 | #116 | Exceptional 8.3% |
| Immigrants | Greece | 97.9 /100 | #117 | Exceptional 8.3% |
| Immigrants | Middle Africa | 97.9 /100 | #118 | Exceptional 8.3% |
| Japanese | 97.5 /100 | #119 | Exceptional 8.3% |
| Immigrants | Asia | 97.4 /100 | #120 | Exceptional 8.3% |
| Immigrants | Croatia | 97.2 /100 | #121 | Exceptional 8.3% |
| Immigrants | Russia | 97.1 /100 | #122 | Exceptional 8.3% |
| Immigrants | Nepal | 96.9 /100 | #123 | Exceptional 8.3% |
Demographics Similar to Carpatho Rusyns by Unemployment Among Seniors over 75 years
In terms of unemployment among seniors over 75 years, the demographic groups most similar to Carpatho Rusyns are European (9.7%, a difference of 0.030%), Nigerian (9.7%, a difference of 0.060%), Danish (9.7%, a difference of 0.17%), Immigrants from Nigeria (9.6%, a difference of 0.24%), and Macedonian (9.6%, a difference of 0.28%).
| Demographics | Rating | Rank | Unemployment Among Seniors over 75 years |
| Immigrants | Senegal | 0.1 /100 | #278 | Tragic 9.6% |
| British | 0.1 /100 | #279 | Tragic 9.6% |
| Croatians | 0.1 /100 | #280 | Tragic 9.6% |
| Bangladeshis | 0.1 /100 | #281 | Tragic 9.6% |
| Macedonians | 0.0 /100 | #282 | Tragic 9.6% |
| Immigrants | Nigeria | 0.0 /100 | #283 | Tragic 9.6% |
| Europeans | 0.0 /100 | #284 | Tragic 9.7% |
| Carpatho Rusyns | 0.0 /100 | #285 | Tragic 9.7% |
| Nigerians | 0.0 /100 | #286 | Tragic 9.7% |
| Danes | 0.0 /100 | #287 | Tragic 9.7% |
| Canadians | 0.0 /100 | #288 | Tragic 9.7% |
| Czechs | 0.0 /100 | #289 | Tragic 9.7% |
| Sioux | 0.0 /100 | #290 | Tragic 9.7% |
| Scandinavians | 0.0 /100 | #291 | Tragic 9.7% |
| Immigrants | Western Africa | 0.0 /100 | #292 | Tragic 9.8% |