Pennsylvania German vs Lebanese Unemployment Among Ages 65 to 74 years
COMPARE
Pennsylvania German
Lebanese
Unemployment Among Ages 65 to 74 years
Unemployment Among Ages 65 to 74 years Comparison
Pennsylvania Germans
Lebanese
5.8%
UNEMPLOYMENT AMONG AGES 65 TO 74 YEARS
0.0/ 100
METRIC RATING
296th/ 347
METRIC RANK
4.9%
UNEMPLOYMENT AMONG AGES 65 TO 74 YEARS
100.0/ 100
METRIC RATING
22nd/ 347
METRIC RANK
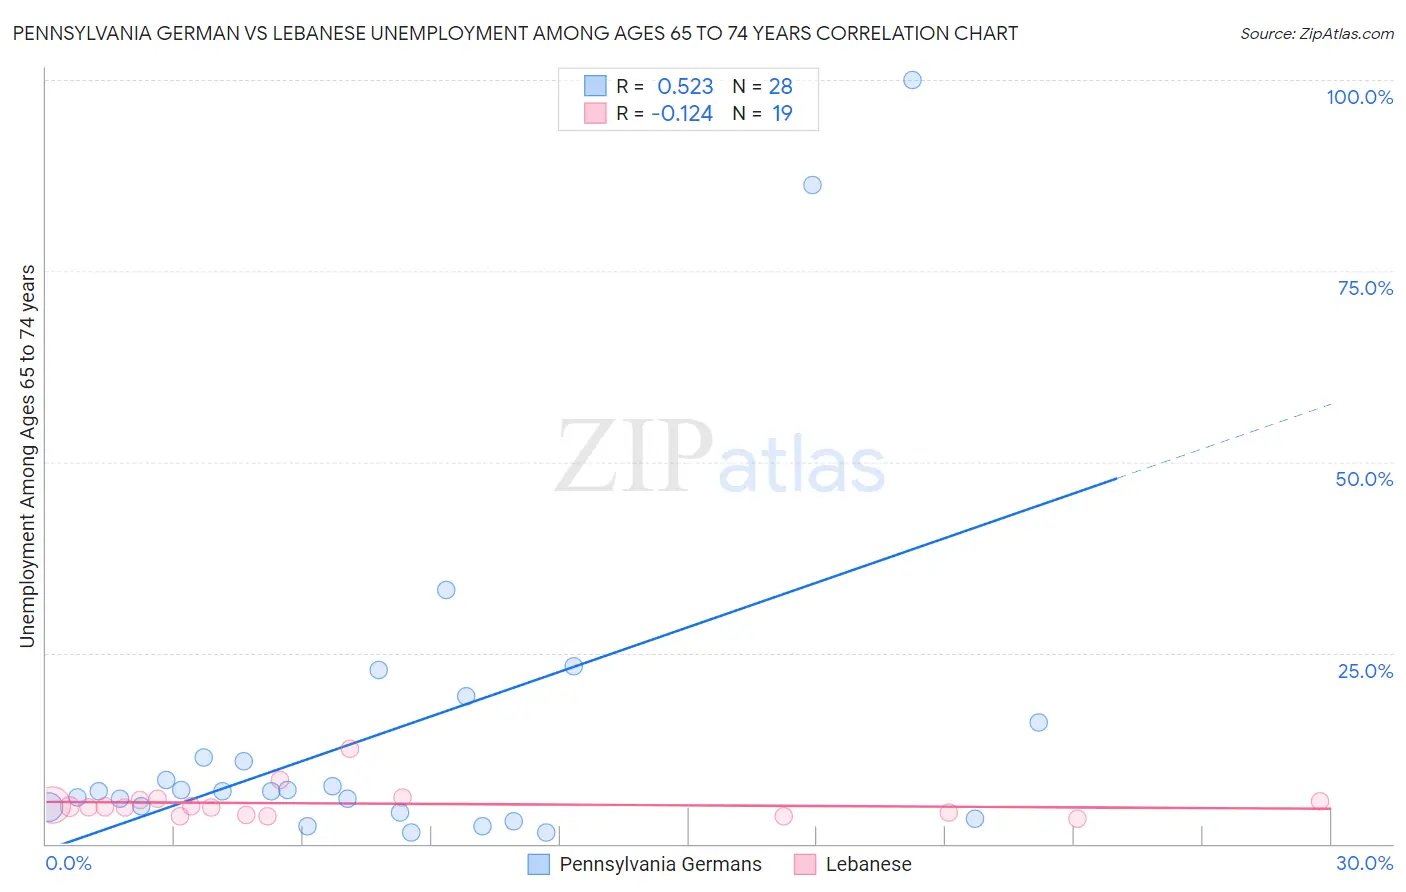
Pennsylvania German vs Lebanese Unemployment Among Ages 65 to 74 years Correlation Chart
The statistical analysis conducted on geographies consisting of 205,280,371 people shows a substantial positive correlation between the proportion of Pennsylvania Germans and unemployment rate among population between the ages 65 and 74 in the United States with a correlation coefficient (R) of 0.523 and weighted average of 5.8%. Similarly, the statistical analysis conducted on geographies consisting of 352,325,673 people shows a poor negative correlation between the proportion of Lebanese and unemployment rate among population between the ages 65 and 74 in the United States with a correlation coefficient (R) of -0.124 and weighted average of 4.9%, a difference of 18.4%.
Unemployment Among Ages 65 to 74 years Correlation Summary
| Measurement | Pennsylvania German | Lebanese |
| Minimum | 1.4% | 3.3% |
| Maximum | 100.0% | 12.4% |
| Range | 98.6% | 9.1% |
| Mean | 15.0% | 5.3% |
| Median | 6.9% | 4.8% |
| Interquartile 25% (IQ1) | 4.4% | 3.8% |
| Interquartile 75% (IQ3) | 13.6% | 5.7% |
| Interquartile Range (IQR) | 9.2% | 1.9% |
| Standard Deviation (Sample) | 23.4% | 2.1% |
| Standard Deviation (Population) | 23.0% | 2.0% |
Similar Demographics by Unemployment Among Ages 65 to 74 years
Demographics Similar to Pennsylvania Germans by Unemployment Among Ages 65 to 74 years
In terms of unemployment among ages 65 to 74 years, the demographic groups most similar to Pennsylvania Germans are Houma (5.8%, a difference of 0.17%), Immigrants from Latin America (5.8%, a difference of 0.36%), Barbadian (5.8%, a difference of 0.37%), Ecuadorian (5.8%, a difference of 0.38%), and Black/African American (5.8%, a difference of 0.46%).
| Demographics | Rating | Rank | Unemployment Among Ages 65 to 74 years |
| Immigrants | Somalia | 0.0 /100 | #289 | Tragic 5.7% |
| Spanish American Indians | 0.0 /100 | #290 | Tragic 5.7% |
| Portuguese | 0.0 /100 | #291 | Tragic 5.7% |
| U.S. Virgin Islanders | 0.0 /100 | #292 | Tragic 5.8% |
| Immigrants | Grenada | 0.0 /100 | #293 | Tragic 5.8% |
| Immigrants | Morocco | 0.0 /100 | #294 | Tragic 5.8% |
| Blacks/African Americans | 0.0 /100 | #295 | Tragic 5.8% |
| Pennsylvania Germans | 0.0 /100 | #296 | Tragic 5.8% |
| Houma | 0.0 /100 | #297 | Tragic 5.8% |
| Immigrants | Latin America | 0.0 /100 | #298 | Tragic 5.8% |
| Barbadians | 0.0 /100 | #299 | Tragic 5.8% |
| Ecuadorians | 0.0 /100 | #300 | Tragic 5.8% |
| Armenians | 0.0 /100 | #301 | Tragic 5.8% |
| Liberians | 0.0 /100 | #302 | Tragic 5.8% |
| Arapaho | 0.0 /100 | #303 | Tragic 5.8% |
Demographics Similar to Lebanese by Unemployment Among Ages 65 to 74 years
In terms of unemployment among ages 65 to 74 years, the demographic groups most similar to Lebanese are Immigrants from Nepal (4.9%, a difference of 0.38%), Iraqi (4.9%, a difference of 0.59%), Immigrants from Eritrea (4.9%, a difference of 0.75%), Immigrants from Zaire (4.8%, a difference of 1.1%), and Macedonian (5.0%, a difference of 1.2%).
| Demographics | Rating | Rank | Unemployment Among Ages 65 to 74 years |
| Immigrants | North Macedonia | 100.0 /100 | #15 | Exceptional 4.8% |
| Immigrants | Burma/Myanmar | 100.0 /100 | #16 | Exceptional 4.8% |
| Kenyans | 100.0 /100 | #17 | Exceptional 4.8% |
| Creek | 100.0 /100 | #18 | Exceptional 4.8% |
| Menominee | 100.0 /100 | #19 | Exceptional 4.8% |
| Immigrants | Zaire | 100.0 /100 | #20 | Exceptional 4.8% |
| Immigrants | Eritrea | 100.0 /100 | #21 | Exceptional 4.9% |
| Lebanese | 100.0 /100 | #22 | Exceptional 4.9% |
| Immigrants | Nepal | 100.0 /100 | #23 | Exceptional 4.9% |
| Iraqis | 100.0 /100 | #24 | Exceptional 4.9% |
| Macedonians | 100.0 /100 | #25 | Exceptional 5.0% |
| Czechs | 100.0 /100 | #26 | Exceptional 5.0% |
| Norwegians | 100.0 /100 | #27 | Exceptional 5.0% |
| Bulgarians | 100.0 /100 | #28 | Exceptional 5.0% |
| Ethiopians | 100.0 /100 | #29 | Exceptional 5.0% |