Icelander vs Immigrants from Russia Unemployment Among Seniors over 65 years
COMPARE
Icelander
Immigrants from Russia
Unemployment Among Seniors over 65 years
Unemployment Among Seniors over 65 years Comparison
Icelanders
Immigrants from Russia
5.2%
UNEMPLOYMENT AMONG SENIORS OVER 65 YEARS
45.9/ 100
METRIC RATING
177th/ 347
METRIC RANK
5.1%
UNEMPLOYMENT AMONG SENIORS OVER 65 YEARS
78.5/ 100
METRIC RATING
146th/ 347
METRIC RANK
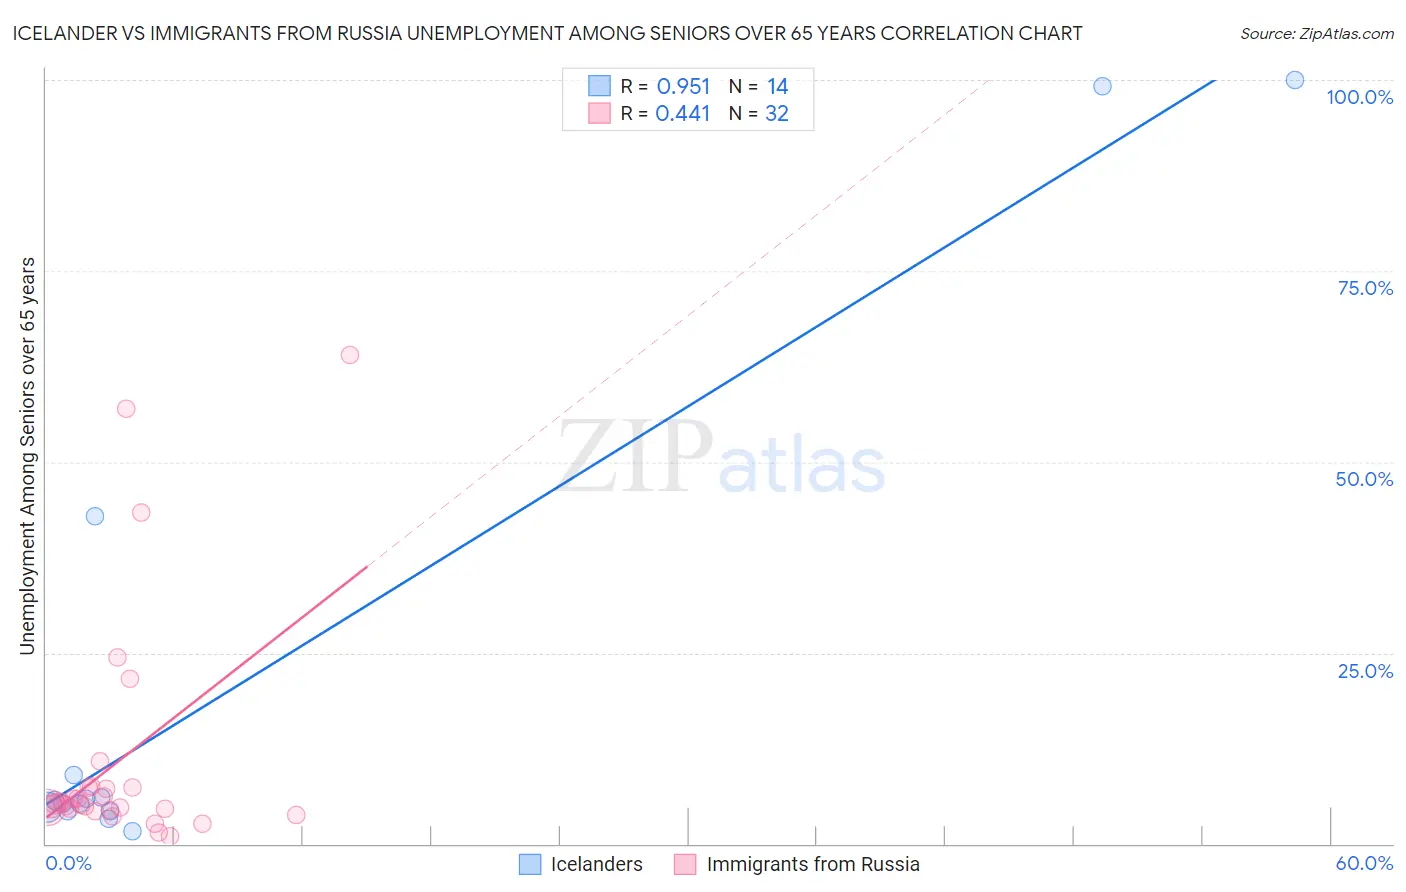
Icelander vs Immigrants from Russia Unemployment Among Seniors over 65 years Correlation Chart
The statistical analysis conducted on geographies consisting of 149,819,205 people shows a perfect positive correlation between the proportion of Icelanders and unemployment rate amomg seniors over the age of 65 in the United States with a correlation coefficient (R) of 0.951 and weighted average of 5.2%. Similarly, the statistical analysis conducted on geographies consisting of 319,054,235 people shows a moderate positive correlation between the proportion of Immigrants from Russia and unemployment rate amomg seniors over the age of 65 in the United States with a correlation coefficient (R) of 0.441 and weighted average of 5.1%, a difference of 1.2%.
Unemployment Among Seniors over 65 years Correlation Summary
| Measurement | Icelander | Immigrants from Russia |
| Minimum | 1.6% | 1.0% |
| Maximum | 100.0% | 64.0% |
| Range | 98.4% | 63.0% |
| Mean | 21.2% | 10.8% |
| Median | 5.5% | 5.2% |
| Interquartile 25% (IQ1) | 4.3% | 4.5% |
| Interquartile 75% (IQ3) | 9.1% | 7.3% |
| Interquartile Range (IQR) | 4.8% | 2.8% |
| Standard Deviation (Sample) | 34.7% | 15.4% |
| Standard Deviation (Population) | 33.5% | 15.1% |
Similar Demographics by Unemployment Among Seniors over 65 years
Demographics Similar to Icelanders by Unemployment Among Seniors over 65 years
In terms of unemployment among seniors over 65 years, the demographic groups most similar to Icelanders are Indian (Asian) (5.2%, a difference of 0.020%), Immigrants from Belgium (5.2%, a difference of 0.040%), Immigrants from Somalia (5.2%, a difference of 0.060%), Russian (5.2%, a difference of 0.070%), and Immigrants from Italy (5.2%, a difference of 0.080%).
| Demographics | Rating | Rank | Unemployment Among Seniors over 65 years |
| Immigrants | Eastern Asia | 54.9 /100 | #170 | Average 5.1% |
| Immigrants | Nonimmigrants | 54.1 /100 | #171 | Average 5.1% |
| Immigrants | Ireland | 53.2 /100 | #172 | Average 5.1% |
| Immigrants | Spain | 51.7 /100 | #173 | Average 5.1% |
| Spanish Americans | 50.0 /100 | #174 | Average 5.1% |
| Immigrants | Eastern Europe | 49.8 /100 | #175 | Average 5.1% |
| Indians (Asian) | 46.6 /100 | #176 | Average 5.2% |
| Icelanders | 45.9 /100 | #177 | Average 5.2% |
| Immigrants | Belgium | 44.8 /100 | #178 | Average 5.2% |
| Immigrants | Somalia | 44.0 /100 | #179 | Average 5.2% |
| Russians | 43.6 /100 | #180 | Average 5.2% |
| Immigrants | Italy | 43.5 /100 | #181 | Average 5.2% |
| Panamanians | 43.0 /100 | #182 | Average 5.2% |
| Immigrants | Western Asia | 42.1 /100 | #183 | Average 5.2% |
| Immigrants | Serbia | 41.6 /100 | #184 | Average 5.2% |
Demographics Similar to Immigrants from Russia by Unemployment Among Seniors over 65 years
In terms of unemployment among seniors over 65 years, the demographic groups most similar to Immigrants from Russia are Spanish (5.1%, a difference of 0.010%), Slovak (5.1%, a difference of 0.030%), Greek (5.1%, a difference of 0.070%), Immigrants from Afghanistan (5.1%, a difference of 0.080%), and Senegalese (5.1%, a difference of 0.090%).
| Demographics | Rating | Rank | Unemployment Among Seniors over 65 years |
| Immigrants | Panama | 83.0 /100 | #139 | Excellent 5.1% |
| Immigrants | Chile | 83.0 /100 | #140 | Excellent 5.1% |
| Cherokee | 81.6 /100 | #141 | Excellent 5.1% |
| Immigrants | Indonesia | 81.0 /100 | #142 | Excellent 5.1% |
| Senegalese | 80.4 /100 | #143 | Excellent 5.1% |
| Poles | 80.3 /100 | #144 | Excellent 5.1% |
| Spanish | 78.8 /100 | #145 | Good 5.1% |
| Immigrants | Russia | 78.5 /100 | #146 | Good 5.1% |
| Slovaks | 77.9 /100 | #147 | Good 5.1% |
| Greeks | 77.0 /100 | #148 | Good 5.1% |
| Immigrants | Afghanistan | 76.8 /100 | #149 | Good 5.1% |
| Immigrants | Asia | 75.6 /100 | #150 | Good 5.1% |
| Pakistanis | 75.5 /100 | #151 | Good 5.1% |
| Canadians | 74.7 /100 | #152 | Good 5.1% |
| Immigrants | Czechoslovakia | 74.5 /100 | #153 | Good 5.1% |