Spanish vs Iraqi Unemployment Among Ages 35 to 44 years
COMPARE
Spanish
Iraqi
Unemployment Among Ages 35 to 44 years
Unemployment Among Ages 35 to 44 years Comparison
Spanish
Iraqis
4.8%
UNEMPLOYMENT AMONG AGES 35 TO 44 YEARS
30.4/ 100
METRIC RATING
193rd/ 347
METRIC RANK
4.7%
UNEMPLOYMENT AMONG AGES 35 TO 44 YEARS
50.9/ 100
METRIC RATING
173rd/ 347
METRIC RANK
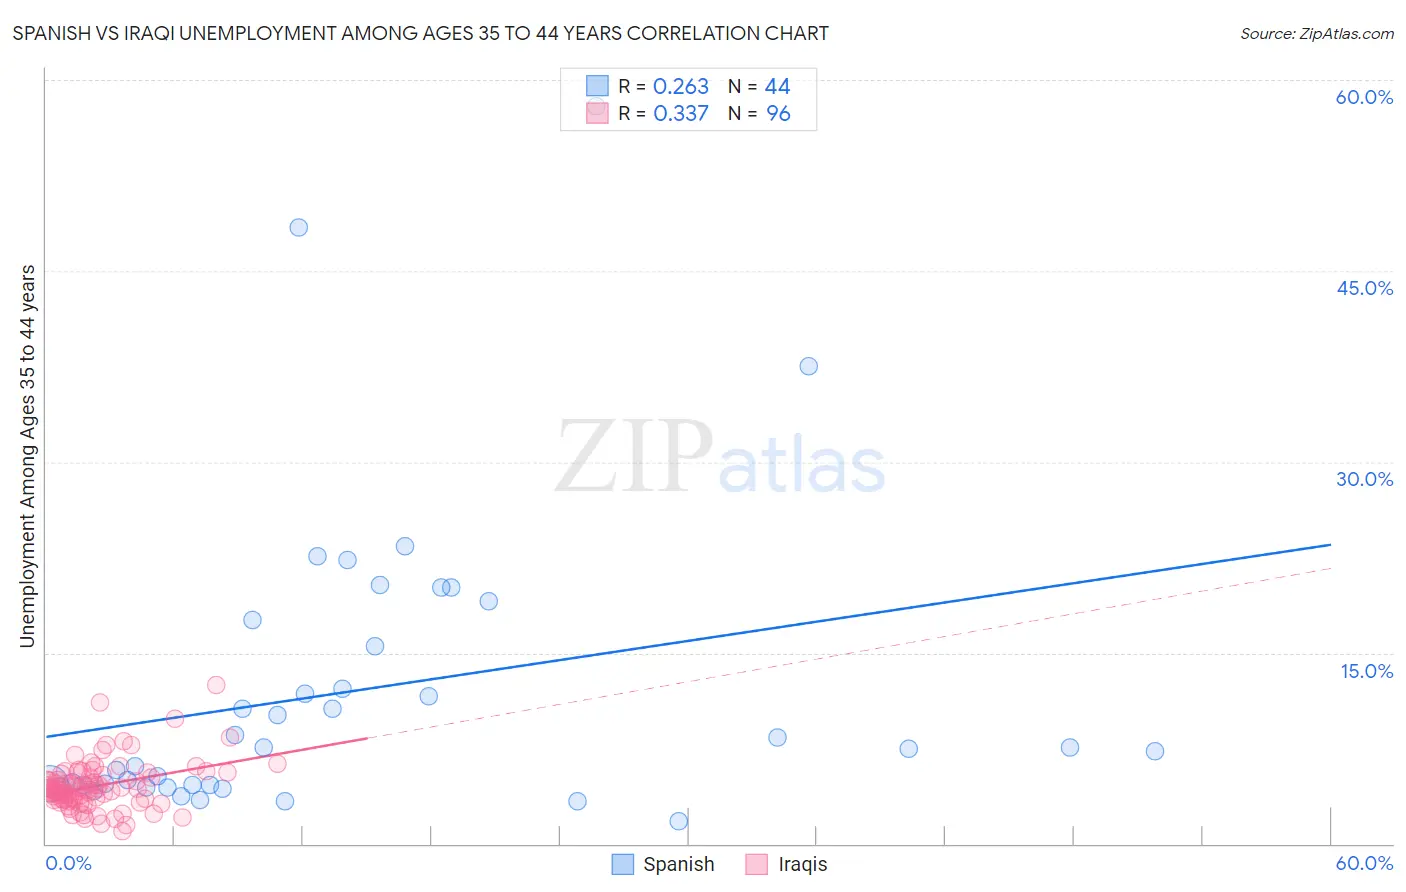
Spanish vs Iraqi Unemployment Among Ages 35 to 44 years Correlation Chart
The statistical analysis conducted on geographies consisting of 410,791,677 people shows a weak positive correlation between the proportion of Spanish and unemployment rate among population between the ages 35 and 44 in the United States with a correlation coefficient (R) of 0.263 and weighted average of 4.8%. Similarly, the statistical analysis conducted on geographies consisting of 169,697,625 people shows a mild positive correlation between the proportion of Iraqis and unemployment rate among population between the ages 35 and 44 in the United States with a correlation coefficient (R) of 0.337 and weighted average of 4.7%, a difference of 1.5%.
Unemployment Among Ages 35 to 44 years Correlation Summary
| Measurement | Spanish | Iraqi |
| Minimum | 1.8% | 1.0% |
| Maximum | 57.9% | 12.5% |
| Range | 56.1% | 11.5% |
| Mean | 12.0% | 4.5% |
| Median | 7.5% | 4.3% |
| Interquartile 25% (IQ1) | 4.6% | 3.5% |
| Interquartile 75% (IQ3) | 16.5% | 5.3% |
| Interquartile Range (IQR) | 11.9% | 1.8% |
| Standard Deviation (Sample) | 11.8% | 1.9% |
| Standard Deviation (Population) | 11.7% | 1.9% |
Demographics Similar to Spanish and Iraqis by Unemployment Among Ages 35 to 44 years
In terms of unemployment among ages 35 to 44 years, the demographic groups most similar to Spanish are Immigrants from Albania (4.8%, a difference of 0.010%), Immigrants from Southern Europe (4.7%, a difference of 0.27%), Immigrants from South America (4.7%, a difference of 0.27%), Immigrants from Congo (4.7%, a difference of 0.28%), and Immigrants from Laos (4.7%, a difference of 0.32%). Similarly, the demographic groups most similar to Iraqis are Afghan (4.7%, a difference of 0.060%), Immigrants from Germany (4.7%, a difference of 0.14%), Immigrants from Uganda (4.7%, a difference of 0.20%), Slovak (4.7%, a difference of 0.44%), and South American Indian (4.7%, a difference of 0.73%).
| Demographics | Rating | Rank | Unemployment Among Ages 35 to 44 years |
| Iraqis | 50.9 /100 | #173 | Average 4.7% |
| Afghans | 50.0 /100 | #174 | Average 4.7% |
| Immigrants | Germany | 48.9 /100 | #175 | Average 4.7% |
| Immigrants | Uganda | 48.1 /100 | #176 | Average 4.7% |
| Slovaks | 44.6 /100 | #177 | Average 4.7% |
| South American Indians | 40.7 /100 | #178 | Average 4.7% |
| Immigrants | South Eastern Asia | 40.2 /100 | #179 | Average 4.7% |
| Immigrants | Peru | 39.9 /100 | #180 | Fair 4.7% |
| Brazilians | 39.5 /100 | #181 | Fair 4.7% |
| Israelis | 38.5 /100 | #182 | Fair 4.7% |
| Immigrants | Poland | 37.9 /100 | #183 | Fair 4.7% |
| Immigrants | Zaire | 37.3 /100 | #184 | Fair 4.7% |
| Immigrants | Costa Rica | 37.0 /100 | #185 | Fair 4.7% |
| Cypriots | 36.5 /100 | #186 | Fair 4.7% |
| Malaysians | 35.5 /100 | #187 | Fair 4.7% |
| Immigrants | Laos | 34.5 /100 | #188 | Fair 4.7% |
| Immigrants | Congo | 33.9 /100 | #189 | Fair 4.7% |
| Immigrants | Southern Europe | 33.8 /100 | #190 | Fair 4.7% |
| Immigrants | South America | 33.8 /100 | #191 | Fair 4.7% |
| Immigrants | Albania | 30.5 /100 | #192 | Fair 4.8% |
| Spanish | 30.4 /100 | #193 | Fair 4.8% |