Spanish vs Immigrants from Laos Unemployment Among Ages 16 to 19 years
COMPARE
Spanish
Immigrants from Laos
Unemployment Among Ages 16 to 19 years
Unemployment Among Ages 16 to 19 years Comparison
Spanish
Immigrants from Laos
17.3%
UNEMPLOYMENT AMONG AGES 16 TO 19 YEARS
79.3/ 100
METRIC RATING
142nd/ 347
METRIC RANK
17.1%
UNEMPLOYMENT AMONG AGES 16 TO 19 YEARS
88.8/ 100
METRIC RATING
123rd/ 347
METRIC RANK
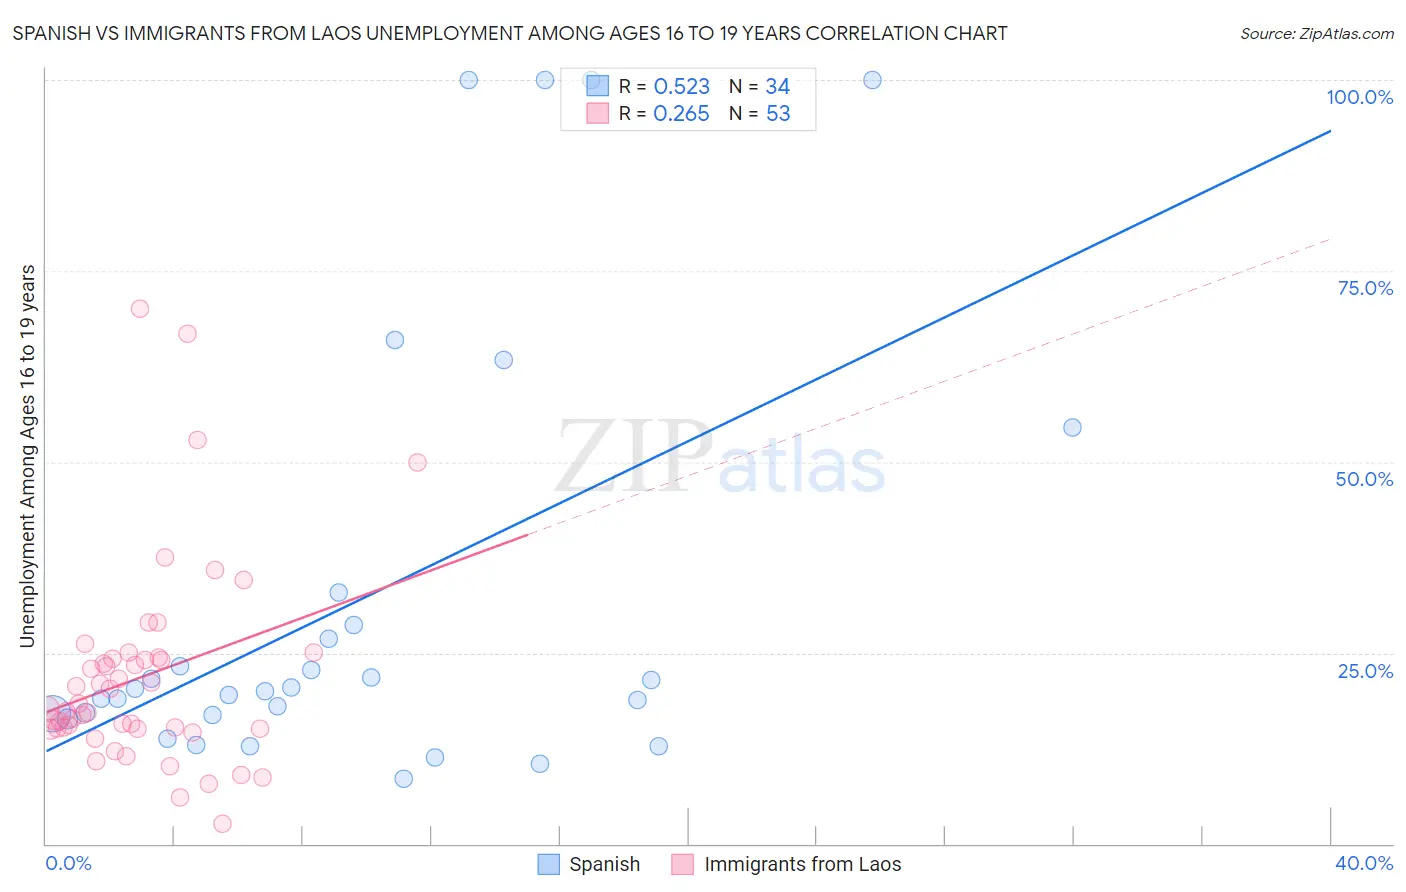
Spanish vs Immigrants from Laos Unemployment Among Ages 16 to 19 years Correlation Chart
The statistical analysis conducted on geographies consisting of 398,416,899 people shows a substantial positive correlation between the proportion of Spanish and unemployment rate among population between the ages 16 and 19 in the United States with a correlation coefficient (R) of 0.523 and weighted average of 17.3%. Similarly, the statistical analysis conducted on geographies consisting of 196,817,615 people shows a weak positive correlation between the proportion of Immigrants from Laos and unemployment rate among population between the ages 16 and 19 in the United States with a correlation coefficient (R) of 0.265 and weighted average of 17.1%, a difference of 0.88%.
Unemployment Among Ages 16 to 19 years Correlation Summary
| Measurement | Spanish | Immigrants from Laos |
| Minimum | 8.4% | 2.6% |
| Maximum | 100.0% | 70.0% |
| Range | 91.6% | 67.4% |
| Mean | 32.0% | 21.8% |
| Median | 20.1% | 17.6% |
| Interquartile 25% (IQ1) | 16.9% | 15.0% |
| Interquartile 75% (IQ3) | 28.6% | 24.3% |
| Interquartile Range (IQR) | 11.7% | 9.3% |
| Standard Deviation (Sample) | 28.5% | 13.3% |
| Standard Deviation (Population) | 28.0% | 13.2% |
Demographics Similar to Spanish and Immigrants from Laos by Unemployment Among Ages 16 to 19 years
In terms of unemployment among ages 16 to 19 years, the demographic groups most similar to Spanish are Basque (17.3%, a difference of 0.11%), Immigrants from Croatia (17.3%, a difference of 0.12%), Immigrants from Eritrea (17.3%, a difference of 0.14%), Bolivian (17.3%, a difference of 0.21%), and Immigrants from Malaysia (17.2%, a difference of 0.28%). Similarly, the demographic groups most similar to Immigrants from Laos are Syrian (17.1%, a difference of 0.020%), Immigrants from Germany (17.2%, a difference of 0.13%), Immigrants from Bolivia (17.2%, a difference of 0.23%), Immigrants from South Eastern Asia (17.1%, a difference of 0.25%), and Pakistani (17.2%, a difference of 0.33%).
| Demographics | Rating | Rank | Unemployment Among Ages 16 to 19 years |
| Immigrants | South Eastern Asia | 90.7 /100 | #122 | Exceptional 17.1% |
| Immigrants | Laos | 88.8 /100 | #123 | Excellent 17.1% |
| Syrians | 88.6 /100 | #124 | Excellent 17.1% |
| Immigrants | Germany | 87.7 /100 | #125 | Excellent 17.2% |
| Immigrants | Bolivia | 86.7 /100 | #126 | Excellent 17.2% |
| Pakistanis | 85.8 /100 | #127 | Excellent 17.2% |
| Australians | 85.6 /100 | #128 | Excellent 17.2% |
| Creek | 85.5 /100 | #129 | Excellent 17.2% |
| Immigrants | Indonesia | 84.7 /100 | #130 | Excellent 17.2% |
| German Russians | 84.1 /100 | #131 | Excellent 17.2% |
| Arabs | 83.9 /100 | #132 | Excellent 17.2% |
| Laotians | 83.9 /100 | #133 | Excellent 17.2% |
| Potawatomi | 83.8 /100 | #134 | Excellent 17.2% |
| Samoans | 83.7 /100 | #135 | Excellent 17.2% |
| Immigrants | Oceania | 83.1 /100 | #136 | Excellent 17.2% |
| Immigrants | Malaysia | 82.8 /100 | #137 | Excellent 17.2% |
| Bolivians | 81.9 /100 | #138 | Excellent 17.3% |
| Immigrants | Eritrea | 81.1 /100 | #139 | Excellent 17.3% |
| Immigrants | Croatia | 80.8 /100 | #140 | Excellent 17.3% |
| Basques | 80.7 /100 | #141 | Excellent 17.3% |
| Spanish | 79.3 /100 | #142 | Good 17.3% |