Spanish American Indian vs Immigrants from South Eastern Asia Unemployment Among Ages 25 to 29 years
COMPARE
Spanish American Indian
Immigrants from South Eastern Asia
Unemployment Among Ages 25 to 29 years
Unemployment Among Ages 25 to 29 years Comparison
Spanish American Indians
Immigrants from South Eastern Asia
7.1%
UNEMPLOYMENT AMONG AGES 25 TO 29 YEARS
1.1/ 100
METRIC RATING
242nd/ 347
METRIC RANK
6.7%
UNEMPLOYMENT AMONG AGES 25 TO 29 YEARS
49.1/ 100
METRIC RATING
175th/ 347
METRIC RANK
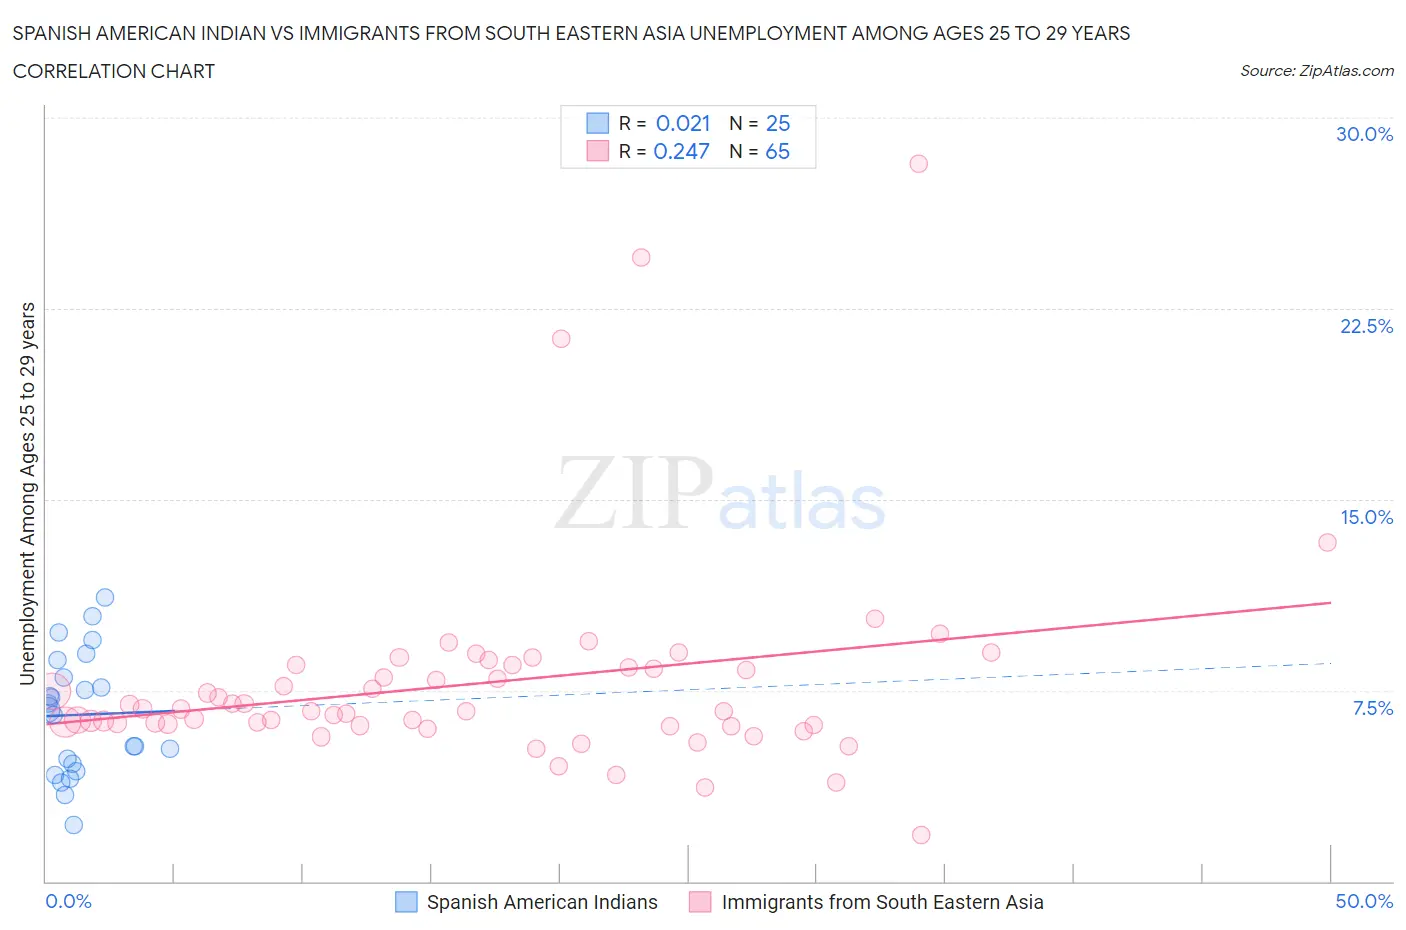
Spanish American Indian vs Immigrants from South Eastern Asia Unemployment Among Ages 25 to 29 years Correlation Chart
The statistical analysis conducted on geographies consisting of 72,626,200 people shows no correlation between the proportion of Spanish American Indians and unemployment rate among population between the ages 25 and 29 in the United States with a correlation coefficient (R) of 0.021 and weighted average of 7.1%. Similarly, the statistical analysis conducted on geographies consisting of 474,351,978 people shows a weak positive correlation between the proportion of Immigrants from South Eastern Asia and unemployment rate among population between the ages 25 and 29 in the United States with a correlation coefficient (R) of 0.247 and weighted average of 6.7%, a difference of 6.9%.
Unemployment Among Ages 25 to 29 years Correlation Summary
| Measurement | Spanish American Indian | Immigrants from South Eastern Asia |
| Minimum | 2.2% | 1.8% |
| Maximum | 11.2% | 28.2% |
| Range | 9.0% | 26.4% |
| Mean | 6.5% | 7.8% |
| Median | 6.7% | 6.7% |
| Interquartile 25% (IQ1) | 4.5% | 6.1% |
| Interquartile 75% (IQ3) | 8.3% | 8.4% |
| Interquartile Range (IQR) | 3.9% | 2.3% |
| Standard Deviation (Sample) | 2.4% | 4.2% |
| Standard Deviation (Population) | 2.3% | 4.1% |
Similar Demographics by Unemployment Among Ages 25 to 29 years
Demographics Similar to Spanish American Indians by Unemployment Among Ages 25 to 29 years
In terms of unemployment among ages 25 to 29 years, the demographic groups most similar to Spanish American Indians are Yaqui (7.1%, a difference of 0.13%), Nonimmigrants (7.1%, a difference of 0.16%), Immigrants from Sierra Leone (7.1%, a difference of 0.26%), Guatemalan (7.1%, a difference of 0.26%), and Native Hawaiian (7.1%, a difference of 0.30%).
| Demographics | Rating | Rank | Unemployment Among Ages 25 to 29 years |
| Panamanians | 2.1 /100 | #235 | Tragic 7.0% |
| Cape Verdeans | 1.9 /100 | #236 | Tragic 7.0% |
| Puget Sound Salish | 1.8 /100 | #237 | Tragic 7.1% |
| Hondurans | 1.8 /100 | #238 | Tragic 7.1% |
| Potawatomi | 1.3 /100 | #239 | Tragic 7.1% |
| Native Hawaiians | 1.3 /100 | #240 | Tragic 7.1% |
| Immigrants | Sierra Leone | 1.3 /100 | #241 | Tragic 7.1% |
| Spanish American Indians | 1.1 /100 | #242 | Tragic 7.1% |
| Yaqui | 1.0 /100 | #243 | Tragic 7.1% |
| Immigrants | Nonimmigrants | 0.9 /100 | #244 | Tragic 7.1% |
| Guatemalans | 0.9 /100 | #245 | Tragic 7.1% |
| Immigrants | Uzbekistan | 0.7 /100 | #246 | Tragic 7.2% |
| Immigrants | Guatemala | 0.7 /100 | #247 | Tragic 7.2% |
| Sub-Saharan Africans | 0.6 /100 | #248 | Tragic 7.2% |
| Seminole | 0.6 /100 | #249 | Tragic 7.2% |
Demographics Similar to Immigrants from South Eastern Asia by Unemployment Among Ages 25 to 29 years
In terms of unemployment among ages 25 to 29 years, the demographic groups most similar to Immigrants from South Eastern Asia are Immigrants from North America (6.6%, a difference of 0.060%), Osage (6.7%, a difference of 0.060%), Immigrants from Israel (6.7%, a difference of 0.080%), Russian (6.6%, a difference of 0.13%), and Bangladeshi (6.6%, a difference of 0.15%).
| Demographics | Rating | Rank | Unemployment Among Ages 25 to 29 years |
| Estonians | 54.8 /100 | #168 | Average 6.6% |
| South Americans | 54.5 /100 | #169 | Average 6.6% |
| Albanians | 53.5 /100 | #170 | Average 6.6% |
| Immigrants | Cambodia | 52.6 /100 | #171 | Average 6.6% |
| Bangladeshis | 51.6 /100 | #172 | Average 6.6% |
| Russians | 51.3 /100 | #173 | Average 6.6% |
| Immigrants | North America | 50.0 /100 | #174 | Average 6.6% |
| Immigrants | South Eastern Asia | 49.1 /100 | #175 | Average 6.7% |
| Osage | 48.1 /100 | #176 | Average 6.7% |
| Immigrants | Israel | 47.8 /100 | #177 | Average 6.7% |
| Immigrants | Iraq | 45.1 /100 | #178 | Average 6.7% |
| Costa Ricans | 44.9 /100 | #179 | Average 6.7% |
| Immigrants | Africa | 41.1 /100 | #180 | Average 6.7% |
| Immigrants | Western Europe | 41.1 /100 | #181 | Average 6.7% |
| Czechoslovakians | 40.7 /100 | #182 | Average 6.7% |