Spaniard vs Immigrants from Egypt Unemployment Among Ages 45 to 54 years
COMPARE
Spaniard
Immigrants from Egypt
Unemployment Among Ages 45 to 54 years
Unemployment Among Ages 45 to 54 years Comparison
Spaniards
Immigrants from Egypt
4.5%
UNEMPLOYMENT AMONG AGES 45 TO 54 YEARS
54.3/ 100
METRIC RATING
170th/ 347
METRIC RANK
4.5%
UNEMPLOYMENT AMONG AGES 45 TO 54 YEARS
54.7/ 100
METRIC RATING
169th/ 347
METRIC RANK
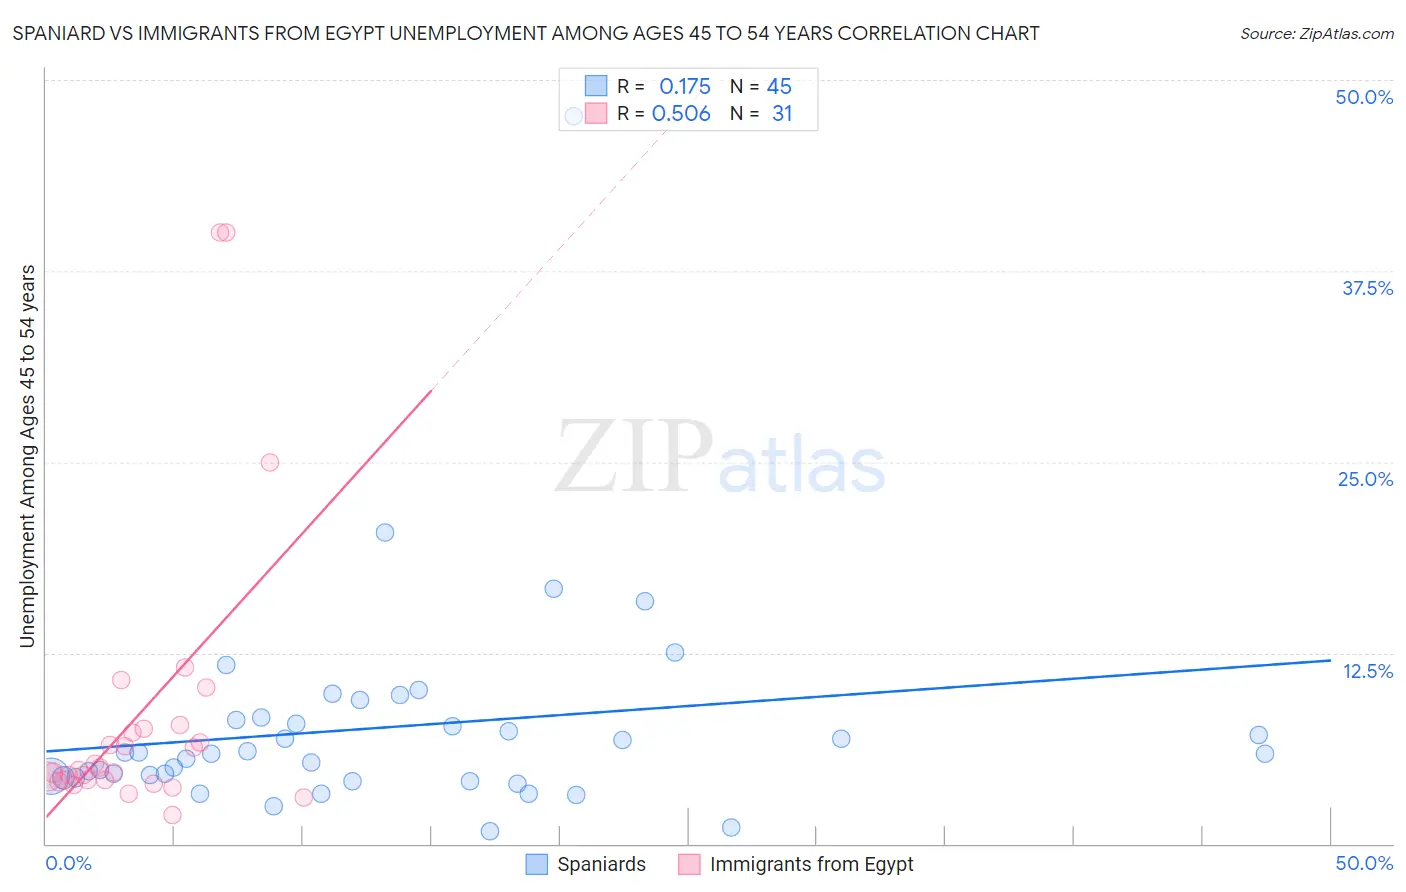
Spaniard vs Immigrants from Egypt Unemployment Among Ages 45 to 54 years Correlation Chart
The statistical analysis conducted on geographies consisting of 429,338,631 people shows a poor positive correlation between the proportion of Spaniards and unemployment rate among population between the ages 45 and 54 in the United States with a correlation coefficient (R) of 0.175 and weighted average of 4.5%. Similarly, the statistical analysis conducted on geographies consisting of 242,697,401 people shows a substantial positive correlation between the proportion of Immigrants from Egypt and unemployment rate among population between the ages 45 and 54 in the United States with a correlation coefficient (R) of 0.506 and weighted average of 4.5%, a difference of 0.020%.
Unemployment Among Ages 45 to 54 years Correlation Summary
| Measurement | Spaniard | Immigrants from Egypt |
| Minimum | 0.80% | 1.9% |
| Maximum | 47.6% | 40.0% |
| Range | 46.8% | 38.1% |
| Mean | 7.6% | 8.4% |
| Median | 5.9% | 4.8% |
| Interquartile 25% (IQ1) | 4.3% | 4.2% |
| Interquartile 75% (IQ3) | 8.2% | 7.5% |
| Interquartile Range (IQR) | 3.9% | 3.3% |
| Standard Deviation (Sample) | 7.2% | 9.4% |
| Standard Deviation (Population) | 7.2% | 9.2% |
Demographics Similar to Spaniards and Immigrants from Egypt by Unemployment Among Ages 45 to 54 years
In terms of unemployment among ages 45 to 54 years, the demographic groups most similar to Spaniards are Immigrants from Europe (4.5%, a difference of 0.020%), Egyptian (4.5%, a difference of 0.030%), Colombian (4.5%, a difference of 0.040%), Immigrants from Brazil (4.5%, a difference of 0.10%), and Immigrants from Colombia (4.5%, a difference of 0.11%). Similarly, the demographic groups most similar to Immigrants from Egypt are Immigrants from Europe (4.5%, a difference of 0.0%), Egyptian (4.5%, a difference of 0.050%), Colombian (4.5%, a difference of 0.060%), Immigrants from Brazil (4.5%, a difference of 0.080%), and Immigrants from Western Europe (4.5%, a difference of 0.13%).
| Demographics | Rating | Rank | Unemployment Among Ages 45 to 54 years |
| Immigrants | Nonimmigrants | 62.8 /100 | #159 | Good 4.5% |
| Immigrants | South Eastern Asia | 62.0 /100 | #160 | Good 4.5% |
| Immigrants | Eastern Europe | 61.6 /100 | #161 | Good 4.5% |
| Immigrants | Indonesia | 60.3 /100 | #162 | Good 4.5% |
| Bangladeshis | 59.7 /100 | #163 | Average 4.5% |
| Samoans | 58.5 /100 | #164 | Average 4.5% |
| Maltese | 57.9 /100 | #165 | Average 4.5% |
| Immigrants | Western Europe | 57.4 /100 | #166 | Average 4.5% |
| Immigrants | Brazil | 56.4 /100 | #167 | Average 4.5% |
| Immigrants | Europe | 54.7 /100 | #168 | Average 4.5% |
| Immigrants | Egypt | 54.7 /100 | #169 | Average 4.5% |
| Spaniards | 54.3 /100 | #170 | Average 4.5% |
| Egyptians | 53.6 /100 | #171 | Average 4.5% |
| Colombians | 53.3 /100 | #172 | Average 4.5% |
| Immigrants | Colombia | 52.0 /100 | #173 | Average 4.5% |
| Immigrants | Hungary | 50.0 /100 | #174 | Average 4.5% |
| Immigrants | France | 49.4 /100 | #175 | Average 4.5% |
| Puget Sound Salish | 49.1 /100 | #176 | Average 4.5% |
| Immigrants | Northern Africa | 49.0 /100 | #177 | Average 4.5% |
| Immigrants | Australia | 48.5 /100 | #178 | Average 4.5% |
| Immigrants | Russia | 48.2 /100 | #179 | Average 4.5% |