Spaniard vs Immigrants from the Azores Unemployment Among Youth under 25 years
COMPARE
Spaniard
Immigrants from the Azores
Unemployment Among Youth under 25 years
Unemployment Among Youth under 25 years Comparison
Spaniards
Immigrants from the Azores
11.7%
UNEMPLOYMENT AMONG YOUTH UNDER 25 YEARS
39.8/ 100
METRIC RATING
180th/ 347
METRIC RANK
12.2%
UNEMPLOYMENT AMONG YOUTH UNDER 25 YEARS
0.6/ 100
METRIC RATING
243rd/ 347
METRIC RANK
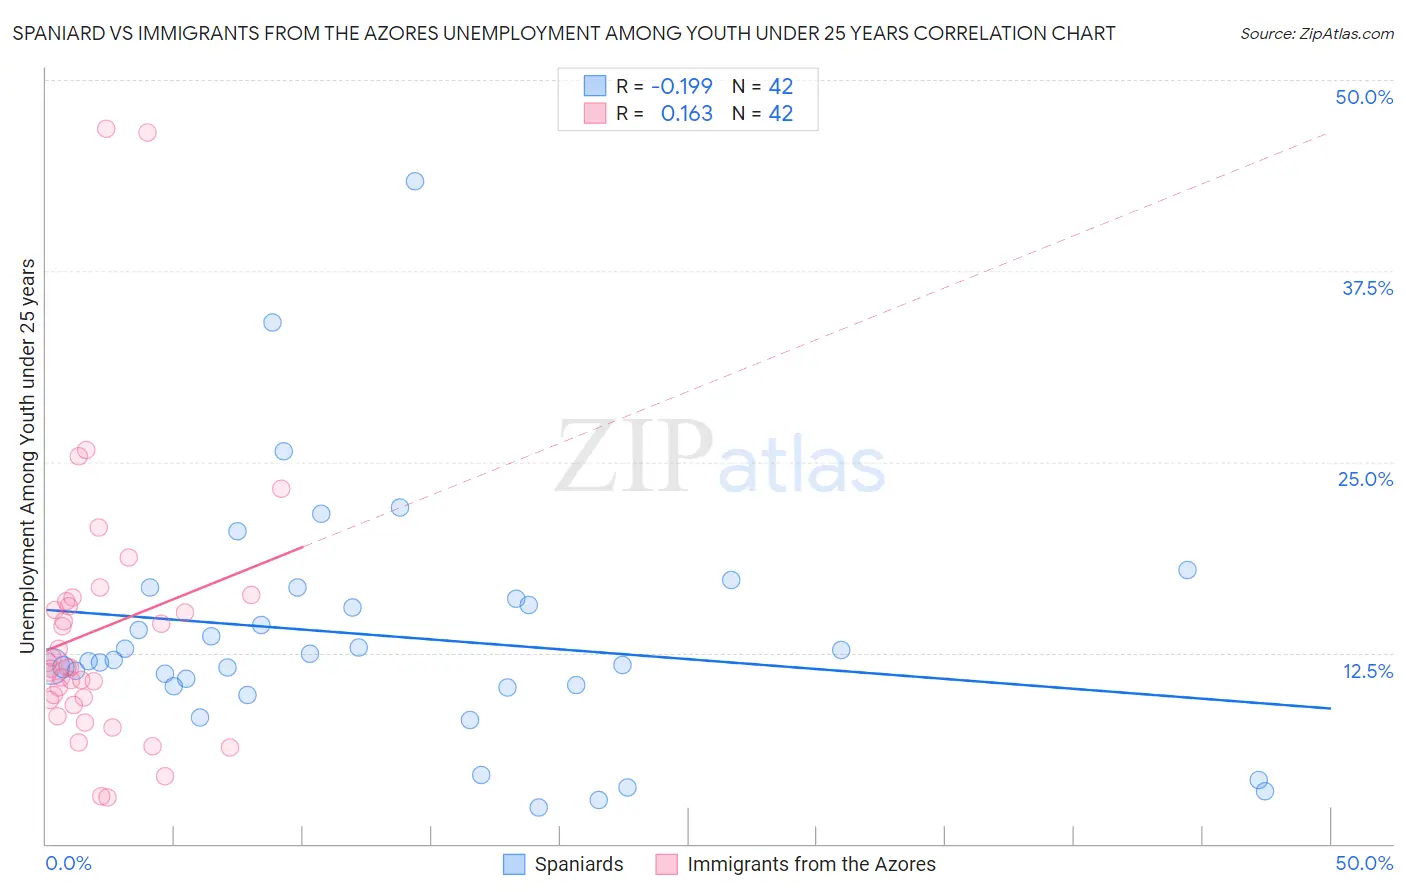
Spaniard vs Immigrants from the Azores Unemployment Among Youth under 25 years Correlation Chart
The statistical analysis conducted on geographies consisting of 436,438,930 people shows a poor negative correlation between the proportion of Spaniards and unemployment rate among youth under the age of 25 in the United States with a correlation coefficient (R) of -0.199 and weighted average of 11.7%. Similarly, the statistical analysis conducted on geographies consisting of 46,132,874 people shows a poor positive correlation between the proportion of Immigrants from the Azores and unemployment rate among youth under the age of 25 in the United States with a correlation coefficient (R) of 0.163 and weighted average of 12.2%, a difference of 4.7%.
Unemployment Among Youth under 25 years Correlation Summary
| Measurement | Spaniard | Immigrants from the Azores |
| Minimum | 2.4% | 3.0% |
| Maximum | 43.4% | 46.8% |
| Range | 41.0% | 43.8% |
| Mean | 13.6% | 14.0% |
| Median | 12.0% | 11.6% |
| Interquartile 25% (IQ1) | 10.3% | 9.4% |
| Interquartile 75% (IQ3) | 16.1% | 15.9% |
| Interquartile Range (IQR) | 5.8% | 6.5% |
| Standard Deviation (Sample) | 7.8% | 9.1% |
| Standard Deviation (Population) | 7.7% | 9.0% |
Similar Demographics by Unemployment Among Youth under 25 years
Demographics Similar to Spaniards by Unemployment Among Youth under 25 years
In terms of unemployment among youth under 25 years, the demographic groups most similar to Spaniards are Syrian (11.7%, a difference of 0.060%), Immigrants from Europe (11.6%, a difference of 0.11%), Immigrants from Hong Kong (11.6%, a difference of 0.11%), Immigrants from Italy (11.7%, a difference of 0.16%), and Immigrants from Denmark (11.6%, a difference of 0.22%).
| Demographics | Rating | Rank | Unemployment Among Youth under 25 years |
| Immigrants | South Eastern Asia | 51.7 /100 | #173 | Average 11.6% |
| Immigrants | China | 50.0 /100 | #174 | Average 11.6% |
| Immigrants | Iraq | 47.0 /100 | #175 | Average 11.6% |
| Ugandans | 45.6 /100 | #176 | Average 11.6% |
| Immigrants | Denmark | 45.0 /100 | #177 | Average 11.6% |
| Immigrants | Europe | 42.4 /100 | #178 | Average 11.6% |
| Immigrants | Hong Kong | 42.4 /100 | #179 | Average 11.6% |
| Spaniards | 39.8 /100 | #180 | Fair 11.7% |
| Syrians | 38.4 /100 | #181 | Fair 11.7% |
| Immigrants | Italy | 36.2 /100 | #182 | Fair 11.7% |
| Americans | 34.5 /100 | #183 | Fair 11.7% |
| Immigrants | Eastern Europe | 34.1 /100 | #184 | Fair 11.7% |
| French American Indians | 34.0 /100 | #185 | Fair 11.7% |
| Maltese | 33.9 /100 | #186 | Fair 11.7% |
| Immigrants | Egypt | 31.9 /100 | #187 | Fair 11.7% |
Demographics Similar to Immigrants from the Azores by Unemployment Among Youth under 25 years
In terms of unemployment among youth under 25 years, the demographic groups most similar to Immigrants from the Azores are Alaskan Athabascan (12.2%, a difference of 0.0%), Spanish American (12.2%, a difference of 0.010%), Immigrants from Honduras (12.2%, a difference of 0.020%), Immigrants from Greece (12.2%, a difference of 0.13%), and Central American (12.2%, a difference of 0.14%).
| Demographics | Rating | Rank | Unemployment Among Youth under 25 years |
| Immigrants | Immigrants | 1.3 /100 | #236 | Tragic 12.1% |
| Native Hawaiians | 1.3 /100 | #237 | Tragic 12.1% |
| Albanians | 1.2 /100 | #238 | Tragic 12.1% |
| Immigrants | Africa | 1.1 /100 | #239 | Tragic 12.1% |
| Dutch West Indians | 1.1 /100 | #240 | Tragic 12.1% |
| Immigrants | Albania | 1.1 /100 | #241 | Tragic 12.1% |
| Immigrants | Western Asia | 0.8 /100 | #242 | Tragic 12.2% |
| Immigrants | Azores | 0.6 /100 | #243 | Tragic 12.2% |
| Alaskan Athabascans | 0.6 /100 | #244 | Tragic 12.2% |
| Spanish Americans | 0.6 /100 | #245 | Tragic 12.2% |
| Immigrants | Honduras | 0.6 /100 | #246 | Tragic 12.2% |
| Immigrants | Greece | 0.6 /100 | #247 | Tragic 12.2% |
| Central Americans | 0.6 /100 | #248 | Tragic 12.2% |
| Soviet Union | 0.6 /100 | #249 | Tragic 12.2% |
| Delaware | 0.4 /100 | #250 | Tragic 12.3% |