Soviet Union vs Yakama Unemployment Among Youth under 25 years
COMPARE
Soviet Union
Yakama
Unemployment Among Youth under 25 years
Unemployment Among Youth under 25 years Comparison
Soviet Union
Yakama
12.2%
UNEMPLOYMENT AMONG YOUTH UNDER 25 YEARS
0.6/ 100
METRIC RATING
249th/ 347
METRIC RANK
15.6%
UNEMPLOYMENT AMONG YOUTH UNDER 25 YEARS
0.0/ 100
METRIC RATING
330th/ 347
METRIC RANK
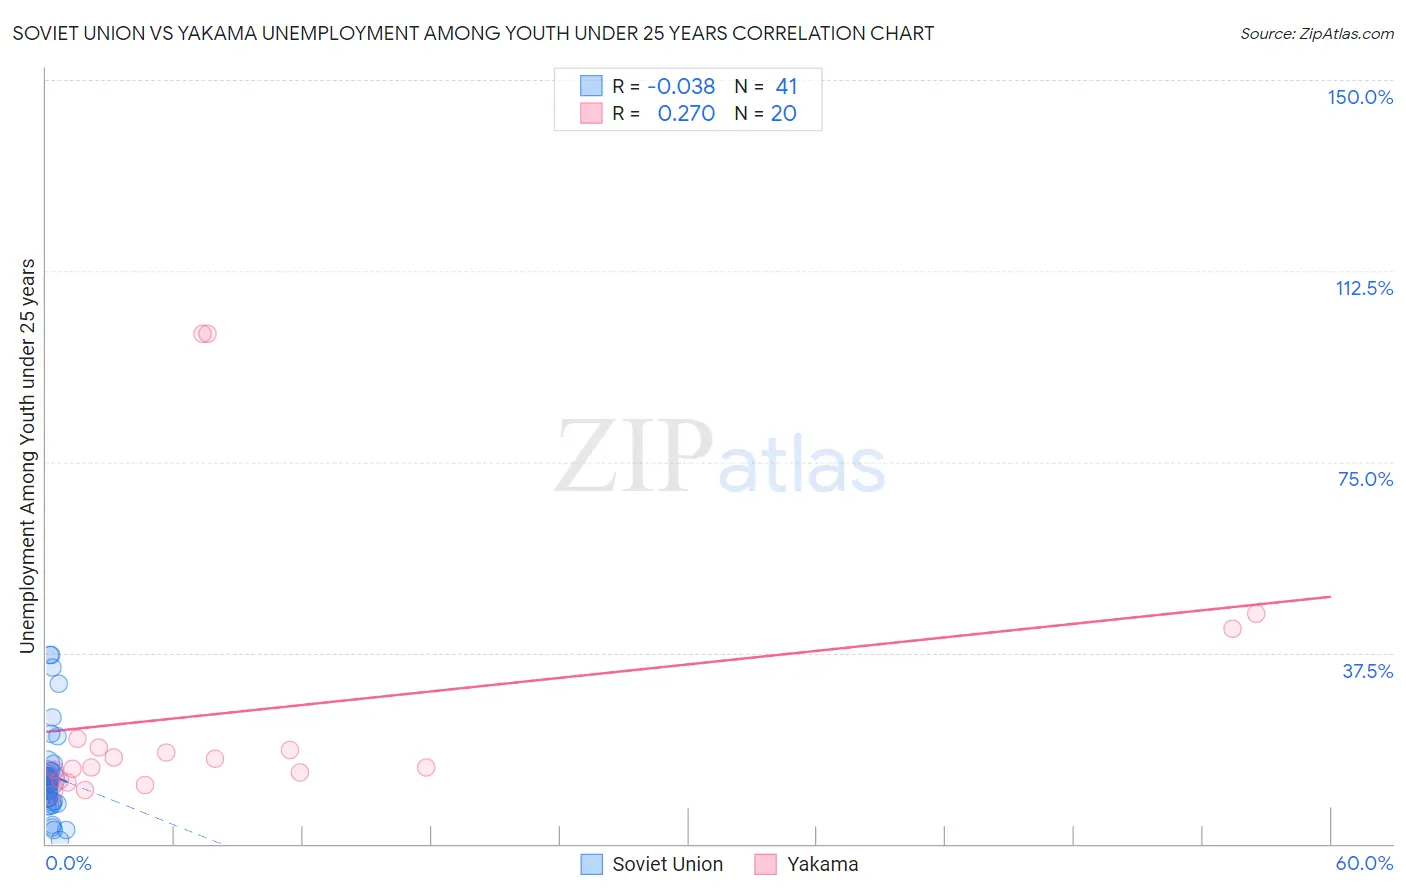
Soviet Union vs Yakama Unemployment Among Youth under 25 years Correlation Chart
The statistical analysis conducted on geographies consisting of 43,455,667 people shows no correlation between the proportion of Soviet Union and unemployment rate among youth under the age of 25 in the United States with a correlation coefficient (R) of -0.038 and weighted average of 12.2%. Similarly, the statistical analysis conducted on geographies consisting of 19,840,397 people shows a weak positive correlation between the proportion of Yakama and unemployment rate among youth under the age of 25 in the United States with a correlation coefficient (R) of 0.270 and weighted average of 15.6%, a difference of 27.5%.
Unemployment Among Youth under 25 years Correlation Summary
| Measurement | Soviet Union | Yakama |
| Minimum | 0.80% | 10.6% |
| Maximum | 37.0% | 100.1% |
| Range | 36.2% | 89.5% |
| Mean | 13.4% | 26.4% |
| Median | 11.9% | 15.9% |
| Interquartile 25% (IQ1) | 8.3% | 13.3% |
| Interquartile 75% (IQ3) | 14.3% | 19.9% |
| Interquartile Range (IQR) | 6.0% | 6.6% |
| Standard Deviation (Sample) | 8.7% | 26.8% |
| Standard Deviation (Population) | 8.6% | 26.2% |
Similar Demographics by Unemployment Among Youth under 25 years
Demographics Similar to Soviet Union by Unemployment Among Youth under 25 years
In terms of unemployment among youth under 25 years, the demographic groups most similar to Soviet Union are Central American (12.2%, a difference of 0.010%), Immigrants from Greece (12.2%, a difference of 0.020%), Immigrants from Honduras (12.2%, a difference of 0.13%), Spanish American (12.2%, a difference of 0.14%), and Immigrants from the Azores (12.2%, a difference of 0.15%).
| Demographics | Rating | Rank | Unemployment Among Youth under 25 years |
| Immigrants | Western Asia | 0.8 /100 | #242 | Tragic 12.2% |
| Immigrants | Azores | 0.6 /100 | #243 | Tragic 12.2% |
| Alaskan Athabascans | 0.6 /100 | #244 | Tragic 12.2% |
| Spanish Americans | 0.6 /100 | #245 | Tragic 12.2% |
| Immigrants | Honduras | 0.6 /100 | #246 | Tragic 12.2% |
| Immigrants | Greece | 0.6 /100 | #247 | Tragic 12.2% |
| Central Americans | 0.6 /100 | #248 | Tragic 12.2% |
| Soviet Union | 0.6 /100 | #249 | Tragic 12.2% |
| Delaware | 0.4 /100 | #250 | Tragic 12.3% |
| Mexican American Indians | 0.4 /100 | #251 | Tragic 12.3% |
| Immigrants | Syria | 0.3 /100 | #252 | Tragic 12.3% |
| Mexicans | 0.3 /100 | #253 | Tragic 12.3% |
| Hondurans | 0.3 /100 | #254 | Tragic 12.3% |
| Hispanics or Latinos | 0.2 /100 | #255 | Tragic 12.4% |
| Liberians | 0.2 /100 | #256 | Tragic 12.4% |
Demographics Similar to Yakama by Unemployment Among Youth under 25 years
In terms of unemployment among youth under 25 years, the demographic groups most similar to Yakama are Immigrants from Yemen (15.6%, a difference of 0.040%), Immigrants from Dominican Republic (15.6%, a difference of 0.17%), British West Indian (15.5%, a difference of 0.28%), Dominican (15.7%, a difference of 0.83%), and Immigrants from Grenada (15.8%, a difference of 1.5%).
| Demographics | Rating | Rank | Unemployment Among Youth under 25 years |
| Immigrants | Trinidad and Tobago | 0.0 /100 | #323 | Tragic 14.6% |
| Immigrants | Jamaica | 0.0 /100 | #324 | Tragic 14.8% |
| Alaska Natives | 0.0 /100 | #325 | Tragic 14.9% |
| Immigrants | Barbados | 0.0 /100 | #326 | Tragic 15.2% |
| British West Indians | 0.0 /100 | #327 | Tragic 15.5% |
| Immigrants | Dominican Republic | 0.0 /100 | #328 | Tragic 15.6% |
| Immigrants | Yemen | 0.0 /100 | #329 | Tragic 15.6% |
| Yakama | 0.0 /100 | #330 | Tragic 15.6% |
| Dominicans | 0.0 /100 | #331 | Tragic 15.7% |
| Immigrants | Grenada | 0.0 /100 | #332 | Tragic 15.8% |
| Guyanese | 0.0 /100 | #333 | Tragic 15.9% |
| Immigrants | Guyana | 0.0 /100 | #334 | Tragic 15.9% |
| Immigrants | St. Vincent and the Grenadines | 0.0 /100 | #335 | Tragic 16.1% |
| Pima | 0.0 /100 | #336 | Tragic 16.2% |
| Arapaho | 0.0 /100 | #337 | Tragic 16.3% |