Soviet Union vs Immigrants from Denmark Unemployment Among Youth under 25 years
COMPARE
Soviet Union
Immigrants from Denmark
Unemployment Among Youth under 25 years
Unemployment Among Youth under 25 years Comparison
Soviet Union
Immigrants from Denmark
12.2%
UNEMPLOYMENT AMONG YOUTH UNDER 25 YEARS
0.6/ 100
METRIC RATING
249th/ 347
METRIC RANK
11.6%
UNEMPLOYMENT AMONG YOUTH UNDER 25 YEARS
45.0/ 100
METRIC RATING
177th/ 347
METRIC RANK
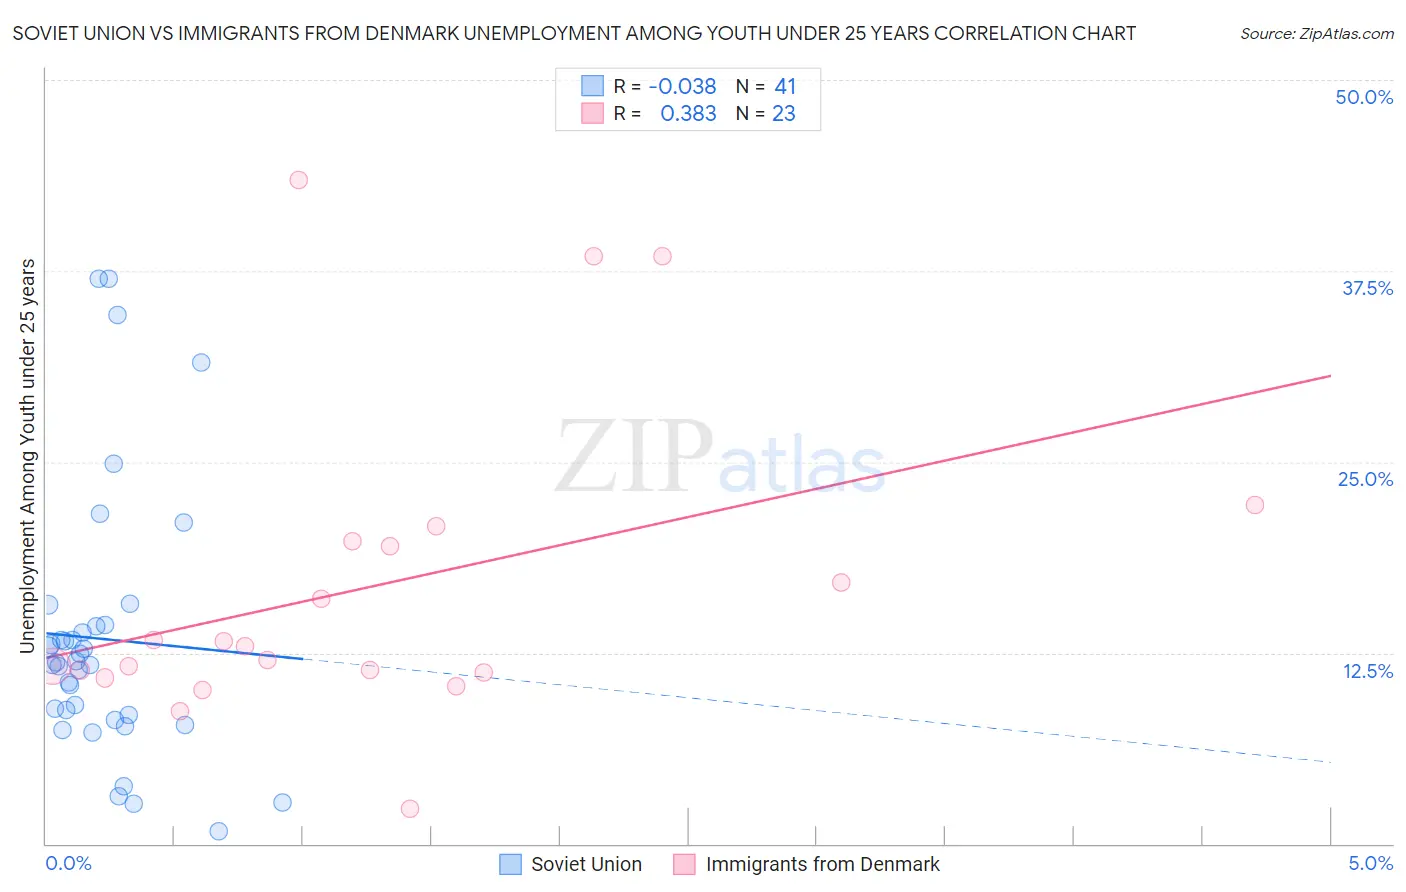
Soviet Union vs Immigrants from Denmark Unemployment Among Youth under 25 years Correlation Chart
The statistical analysis conducted on geographies consisting of 43,455,667 people shows no correlation between the proportion of Soviet Union and unemployment rate among youth under the age of 25 in the United States with a correlation coefficient (R) of -0.038 and weighted average of 12.2%. Similarly, the statistical analysis conducted on geographies consisting of 135,705,555 people shows a mild positive correlation between the proportion of Immigrants from Denmark and unemployment rate among youth under the age of 25 in the United States with a correlation coefficient (R) of 0.383 and weighted average of 11.6%, a difference of 5.1%.
Unemployment Among Youth under 25 years Correlation Summary
| Measurement | Soviet Union | Immigrants from Denmark |
| Minimum | 0.80% | 2.3% |
| Maximum | 37.0% | 43.5% |
| Range | 36.2% | 41.2% |
| Mean | 13.4% | 16.8% |
| Median | 11.9% | 12.9% |
| Interquartile 25% (IQ1) | 8.3% | 11.2% |
| Interquartile 75% (IQ3) | 14.3% | 19.8% |
| Interquartile Range (IQR) | 6.0% | 8.6% |
| Standard Deviation (Sample) | 8.7% | 10.3% |
| Standard Deviation (Population) | 8.6% | 10.0% |
Similar Demographics by Unemployment Among Youth under 25 years
Demographics Similar to Soviet Union by Unemployment Among Youth under 25 years
In terms of unemployment among youth under 25 years, the demographic groups most similar to Soviet Union are Central American (12.2%, a difference of 0.010%), Immigrants from Greece (12.2%, a difference of 0.020%), Immigrants from Honduras (12.2%, a difference of 0.13%), Spanish American (12.2%, a difference of 0.14%), and Immigrants from the Azores (12.2%, a difference of 0.15%).
| Demographics | Rating | Rank | Unemployment Among Youth under 25 years |
| Immigrants | Western Asia | 0.8 /100 | #242 | Tragic 12.2% |
| Immigrants | Azores | 0.6 /100 | #243 | Tragic 12.2% |
| Alaskan Athabascans | 0.6 /100 | #244 | Tragic 12.2% |
| Spanish Americans | 0.6 /100 | #245 | Tragic 12.2% |
| Immigrants | Honduras | 0.6 /100 | #246 | Tragic 12.2% |
| Immigrants | Greece | 0.6 /100 | #247 | Tragic 12.2% |
| Central Americans | 0.6 /100 | #248 | Tragic 12.2% |
| Soviet Union | 0.6 /100 | #249 | Tragic 12.2% |
| Delaware | 0.4 /100 | #250 | Tragic 12.3% |
| Mexican American Indians | 0.4 /100 | #251 | Tragic 12.3% |
| Immigrants | Syria | 0.3 /100 | #252 | Tragic 12.3% |
| Mexicans | 0.3 /100 | #253 | Tragic 12.3% |
| Hondurans | 0.3 /100 | #254 | Tragic 12.3% |
| Hispanics or Latinos | 0.2 /100 | #255 | Tragic 12.4% |
| Liberians | 0.2 /100 | #256 | Tragic 12.4% |
Demographics Similar to Immigrants from Denmark by Unemployment Among Youth under 25 years
In terms of unemployment among youth under 25 years, the demographic groups most similar to Immigrants from Denmark are Ugandan (11.6%, a difference of 0.030%), Immigrants from Iraq (11.6%, a difference of 0.090%), Immigrants from Europe (11.6%, a difference of 0.11%), Immigrants from Hong Kong (11.6%, a difference of 0.11%), and Immigrants from China (11.6%, a difference of 0.21%).
| Demographics | Rating | Rank | Unemployment Among Youth under 25 years |
| Russians | 57.3 /100 | #170 | Average 11.6% |
| Bangladeshis | 55.6 /100 | #171 | Average 11.6% |
| Immigrants | Morocco | 55.1 /100 | #172 | Average 11.6% |
| Immigrants | South Eastern Asia | 51.7 /100 | #173 | Average 11.6% |
| Immigrants | China | 50.0 /100 | #174 | Average 11.6% |
| Immigrants | Iraq | 47.0 /100 | #175 | Average 11.6% |
| Ugandans | 45.6 /100 | #176 | Average 11.6% |
| Immigrants | Denmark | 45.0 /100 | #177 | Average 11.6% |
| Immigrants | Europe | 42.4 /100 | #178 | Average 11.6% |
| Immigrants | Hong Kong | 42.4 /100 | #179 | Average 11.6% |
| Spaniards | 39.8 /100 | #180 | Fair 11.7% |
| Syrians | 38.4 /100 | #181 | Fair 11.7% |
| Immigrants | Italy | 36.2 /100 | #182 | Fair 11.7% |
| Americans | 34.5 /100 | #183 | Fair 11.7% |
| Immigrants | Eastern Europe | 34.1 /100 | #184 | Fair 11.7% |