South African vs Vietnamese Unemployment Among Ages 65 to 74 years
COMPARE
South African
Vietnamese
Unemployment Among Ages 65 to 74 years
Unemployment Among Ages 65 to 74 years Comparison
South Africans
Vietnamese
5.2%
UNEMPLOYMENT AMONG AGES 65 TO 74 YEARS
97.1/ 100
METRIC RATING
94th/ 347
METRIC RANK
5.9%
UNEMPLOYMENT AMONG AGES 65 TO 74 YEARS
0.0/ 100
METRIC RATING
313th/ 347
METRIC RANK
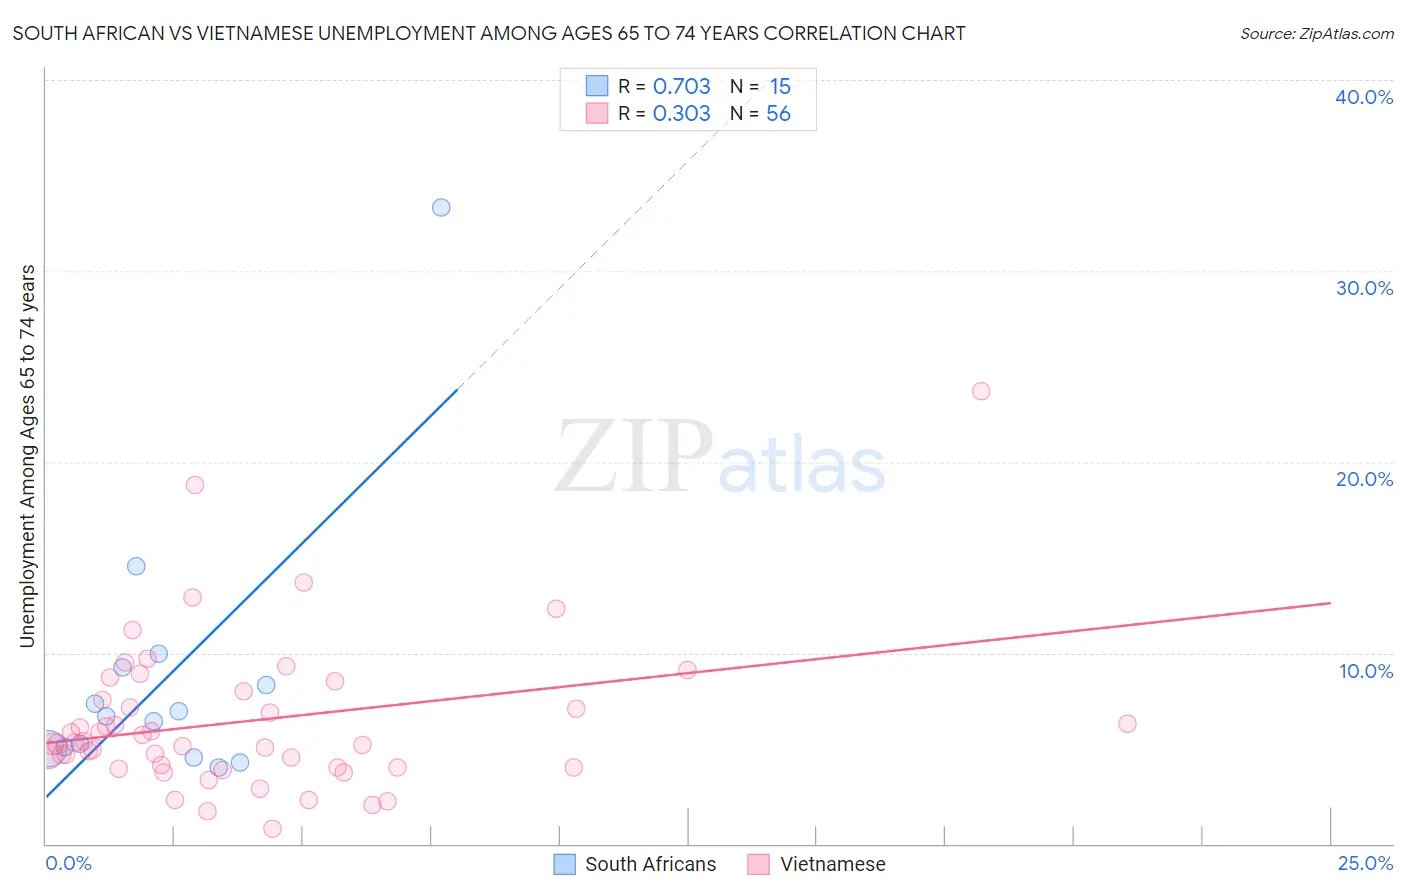
South African vs Vietnamese Unemployment Among Ages 65 to 74 years Correlation Chart
The statistical analysis conducted on geographies consisting of 170,569,944 people shows a strong positive correlation between the proportion of South Africans and unemployment rate among population between the ages 65 and 74 in the United States with a correlation coefficient (R) of 0.703 and weighted average of 5.2%. Similarly, the statistical analysis conducted on geographies consisting of 162,170,002 people shows a mild positive correlation between the proportion of Vietnamese and unemployment rate among population between the ages 65 and 74 in the United States with a correlation coefficient (R) of 0.303 and weighted average of 5.9%, a difference of 12.6%.
Unemployment Among Ages 65 to 74 years Correlation Summary
| Measurement | South African | Vietnamese |
| Minimum | 4.0% | 0.80% |
| Maximum | 33.3% | 23.7% |
| Range | 29.3% | 22.9% |
| Mean | 8.7% | 6.4% |
| Median | 6.7% | 5.3% |
| Interquartile 25% (IQ1) | 5.0% | 4.0% |
| Interquartile 75% (IQ3) | 9.2% | 7.8% |
| Interquartile Range (IQR) | 4.2% | 3.8% |
| Standard Deviation (Sample) | 7.3% | 4.0% |
| Standard Deviation (Population) | 7.1% | 4.0% |
Similar Demographics by Unemployment Among Ages 65 to 74 years
Demographics Similar to South Africans by Unemployment Among Ages 65 to 74 years
In terms of unemployment among ages 65 to 74 years, the demographic groups most similar to South Africans are Serbian (5.2%, a difference of 0.0%), Immigrants from Netherlands (5.2%, a difference of 0.020%), Immigrants from Thailand (5.2%, a difference of 0.030%), Puget Sound Salish (5.2%, a difference of 0.080%), and Romanian (5.2%, a difference of 0.10%).
| Demographics | Rating | Rank | Unemployment Among Ages 65 to 74 years |
| Scottish | 97.9 /100 | #87 | Exceptional 5.2% |
| Immigrants | Saudi Arabia | 97.9 /100 | #88 | Exceptional 5.2% |
| English | 97.8 /100 | #89 | Exceptional 5.2% |
| Luxembourgers | 97.6 /100 | #90 | Exceptional 5.2% |
| Romanians | 97.4 /100 | #91 | Exceptional 5.2% |
| Puget Sound Salish | 97.3 /100 | #92 | Exceptional 5.2% |
| Immigrants | Netherlands | 97.1 /100 | #93 | Exceptional 5.2% |
| South Africans | 97.1 /100 | #94 | Exceptional 5.2% |
| Serbians | 97.0 /100 | #95 | Exceptional 5.2% |
| Immigrants | Thailand | 97.0 /100 | #96 | Exceptional 5.2% |
| Senegalese | 96.5 /100 | #97 | Exceptional 5.2% |
| Welsh | 96.5 /100 | #98 | Exceptional 5.2% |
| Burmese | 96.4 /100 | #99 | Exceptional 5.2% |
| Japanese | 96.4 /100 | #100 | Exceptional 5.2% |
| Immigrants | Cambodia | 96.3 /100 | #101 | Exceptional 5.2% |
Demographics Similar to Vietnamese by Unemployment Among Ages 65 to 74 years
In terms of unemployment among ages 65 to 74 years, the demographic groups most similar to Vietnamese are Immigrants from Venezuela (5.9%, a difference of 0.17%), Immigrants from Guatemala (5.9%, a difference of 0.18%), Hispanic or Latino (5.9%, a difference of 0.19%), Venezuelan (5.9%, a difference of 0.21%), and Immigrants from Bangladesh (5.9%, a difference of 0.25%).
| Demographics | Rating | Rank | Unemployment Among Ages 65 to 74 years |
| Cheyenne | 0.0 /100 | #306 | Tragic 5.8% |
| British West Indians | 0.0 /100 | #307 | Tragic 5.8% |
| Guatemalans | 0.0 /100 | #308 | Tragic 5.8% |
| Immigrants | Ecuador | 0.0 /100 | #309 | Tragic 5.8% |
| Immigrants | Bangladesh | 0.0 /100 | #310 | Tragic 5.9% |
| Venezuelans | 0.0 /100 | #311 | Tragic 5.9% |
| Hispanics or Latinos | 0.0 /100 | #312 | Tragic 5.9% |
| Vietnamese | 0.0 /100 | #313 | Tragic 5.9% |
| Immigrants | Venezuela | 0.0 /100 | #314 | Tragic 5.9% |
| Immigrants | Guatemala | 0.0 /100 | #315 | Tragic 5.9% |
| Immigrants | El Salvador | 0.0 /100 | #316 | Tragic 5.9% |
| Immigrants | Central America | 0.0 /100 | #317 | Tragic 5.9% |
| Zimbabweans | 0.0 /100 | #318 | Tragic 5.9% |
| Aleuts | 0.0 /100 | #319 | Tragic 5.9% |
| Immigrants | Bahamas | 0.0 /100 | #320 | Tragic 5.9% |