Cheyenne vs Israeli Unemployment Among Seniors over 75 years
COMPARE
Cheyenne
Israeli
Unemployment Among Seniors over 75 years
Unemployment Among Seniors over 75 years Comparison
Cheyenne
Israelis
5.9%
UNEMPLOYMENT AMONG SENIORS OVER 75 YEARS
100.0/ 100
METRIC RATING
3rd/ 347
METRIC RANK
7.4%
UNEMPLOYMENT AMONG SENIORS OVER 75 YEARS
100.0/ 100
METRIC RATING
23rd/ 347
METRIC RANK
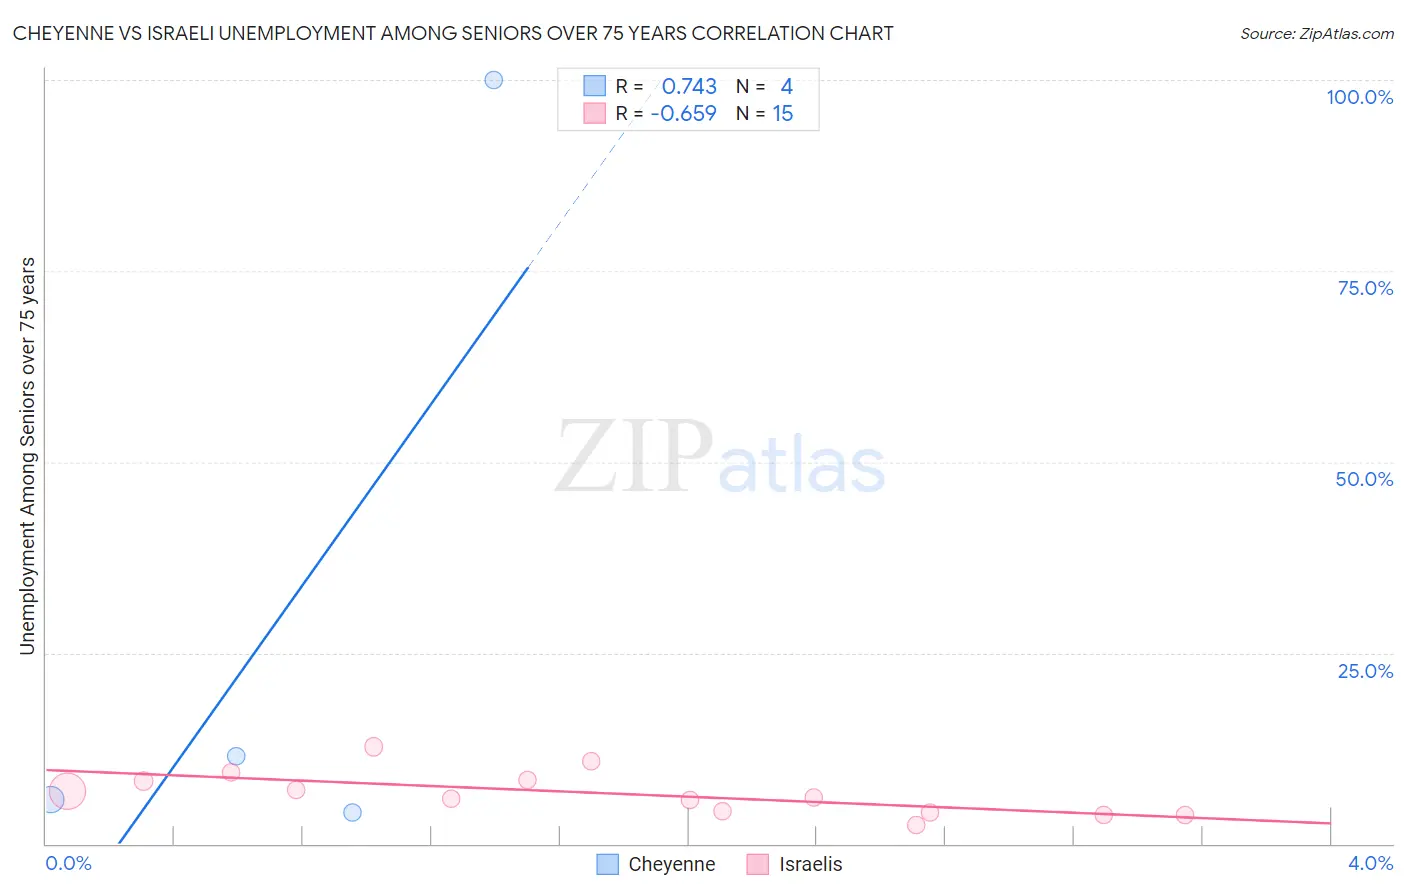
Cheyenne vs Israeli Unemployment Among Seniors over 75 years Correlation Chart
The statistical analysis conducted on geographies consisting of 63,002,461 people shows a strong positive correlation between the proportion of Cheyenne and unemployment rate among seniors over the age of 75 in the United States with a correlation coefficient (R) of 0.743 and weighted average of 5.9%. Similarly, the statistical analysis conducted on geographies consisting of 137,607,512 people shows a significant negative correlation between the proportion of Israelis and unemployment rate among seniors over the age of 75 in the United States with a correlation coefficient (R) of -0.659 and weighted average of 7.4%, a difference of 24.9%.
Unemployment Among Seniors over 75 years Correlation Summary
| Measurement | Cheyenne | Israeli |
| Minimum | 4.1% | 2.5% |
| Maximum | 100.0% | 12.7% |
| Range | 95.9% | 10.2% |
| Mean | 30.4% | 6.6% |
| Median | 8.6% | 6.0% |
| Interquartile 25% (IQ1) | 5.0% | 4.1% |
| Interquartile 75% (IQ3) | 55.8% | 8.3% |
| Interquartile Range (IQR) | 50.8% | 4.2% |
| Standard Deviation (Sample) | 46.5% | 2.9% |
| Standard Deviation (Population) | 40.3% | 2.8% |
Demographics Similar to Cheyenne and Israelis by Unemployment Among Seniors over 75 years
In terms of unemployment among seniors over 75 years, the demographic groups most similar to Cheyenne are Alsatian (6.1%, a difference of 2.9%), Hopi (6.3%, a difference of 5.6%), Immigrants from Armenia (6.5%, a difference of 9.6%), Spanish American Indian (6.5%, a difference of 10.0%), and Taiwanese (6.6%, a difference of 10.4%). Similarly, the demographic groups most similar to Israelis are Cypriot (7.4%, a difference of 0.33%), Chickasaw (7.3%, a difference of 1.1%), Armenian (7.2%, a difference of 2.5%), Immigrants from Zaire (7.2%, a difference of 2.8%), and Immigrants from Uzbekistan (7.2%, a difference of 2.9%).
| Demographics | Rating | Rank | Unemployment Among Seniors over 75 years |
| Cheyenne | 100.0 /100 | #3 | Exceptional 5.9% |
| Alsatians | 100.0 /100 | #4 | Exceptional 6.1% |
| Hopi | 100.0 /100 | #5 | Exceptional 6.3% |
| Immigrants | Armenia | 100.0 /100 | #6 | Exceptional 6.5% |
| Spanish American Indians | 100.0 /100 | #7 | Exceptional 6.5% |
| Taiwanese | 100.0 /100 | #8 | Exceptional 6.6% |
| Soviet Union | 100.0 /100 | #9 | Exceptional 6.6% |
| Yuman | 100.0 /100 | #10 | Exceptional 6.7% |
| Immigrants | Grenada | 100.0 /100 | #11 | Exceptional 6.7% |
| Comanche | 100.0 /100 | #12 | Exceptional 6.7% |
| Immigrants | Congo | 100.0 /100 | #13 | Exceptional 6.7% |
| Ute | 100.0 /100 | #14 | Exceptional 6.8% |
| Icelanders | 100.0 /100 | #15 | Exceptional 7.0% |
| Seminole | 100.0 /100 | #16 | Exceptional 7.1% |
| Immigrants | Switzerland | 100.0 /100 | #17 | Exceptional 7.2% |
| Immigrants | Uzbekistan | 100.0 /100 | #18 | Exceptional 7.2% |
| Immigrants | Zaire | 100.0 /100 | #19 | Exceptional 7.2% |
| Armenians | 100.0 /100 | #20 | Exceptional 7.2% |
| Chickasaw | 100.0 /100 | #21 | Exceptional 7.3% |
| Cypriots | 100.0 /100 | #22 | Exceptional 7.4% |
| Israelis | 100.0 /100 | #23 | Exceptional 7.4% |