Immigrants from Haiti vs Lebanese Unemployment Among Ages 45 to 54 years
COMPARE
Immigrants from Haiti
Lebanese
Unemployment Among Ages 45 to 54 years
Unemployment Among Ages 45 to 54 years Comparison
Immigrants from Haiti
Lebanese
5.2%
UNEMPLOYMENT AMONG AGES 45 TO 54 YEARS
0.0/ 100
METRIC RATING
289th/ 347
METRIC RANK
4.4%
UNEMPLOYMENT AMONG AGES 45 TO 54 YEARS
81.9/ 100
METRIC RATING
137th/ 347
METRIC RANK
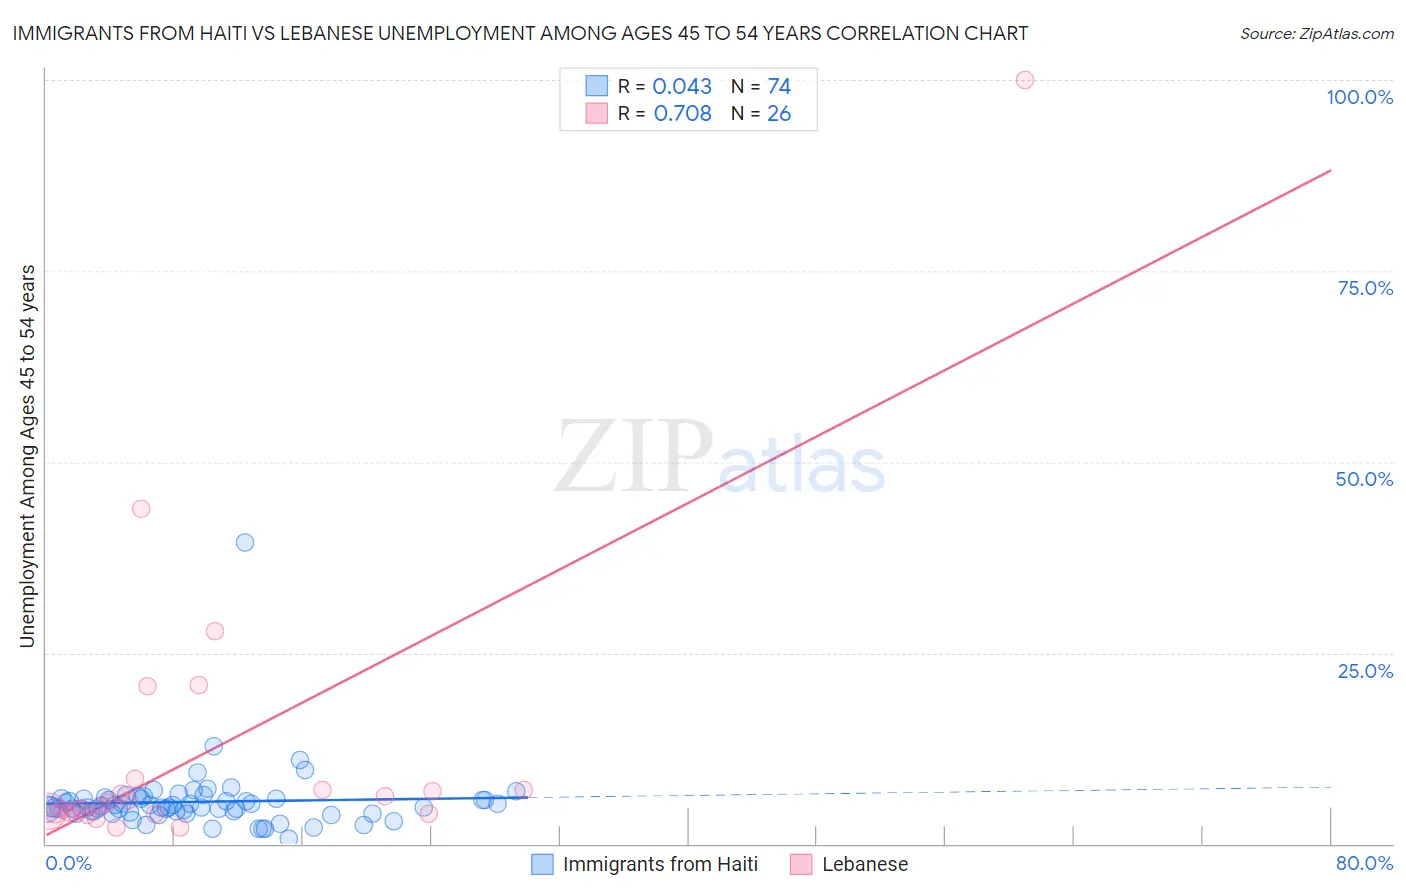
Immigrants from Haiti vs Lebanese Unemployment Among Ages 45 to 54 years Correlation Chart
The statistical analysis conducted on geographies consisting of 221,731,051 people shows no correlation between the proportion of Immigrants from Haiti and unemployment rate among population between the ages 45 and 54 in the United States with a correlation coefficient (R) of 0.043 and weighted average of 5.2%. Similarly, the statistical analysis conducted on geographies consisting of 390,458,993 people shows a strong positive correlation between the proportion of Lebanese and unemployment rate among population between the ages 45 and 54 in the United States with a correlation coefficient (R) of 0.708 and weighted average of 4.4%, a difference of 17.0%.
Unemployment Among Ages 45 to 54 years Correlation Summary
| Measurement | Immigrants from Haiti | Lebanese |
| Minimum | 0.70% | 2.2% |
| Maximum | 39.4% | 100.0% |
| Range | 38.7% | 97.8% |
| Mean | 5.5% | 12.2% |
| Median | 4.8% | 5.2% |
| Interquartile 25% (IQ1) | 4.2% | 4.0% |
| Interquartile 75% (IQ3) | 5.9% | 7.0% |
| Interquartile Range (IQR) | 1.6% | 3.0% |
| Standard Deviation (Sample) | 4.4% | 20.3% |
| Standard Deviation (Population) | 4.4% | 19.9% |
Similar Demographics by Unemployment Among Ages 45 to 54 years
Demographics Similar to Immigrants from Haiti by Unemployment Among Ages 45 to 54 years
In terms of unemployment among ages 45 to 54 years, the demographic groups most similar to Immigrants from Haiti are Immigrants from Portugal (5.2%, a difference of 0.16%), Armenian (5.2%, a difference of 0.17%), Immigrants from Caribbean (5.2%, a difference of 0.39%), Trinidadian and Tobagonian (5.2%, a difference of 0.40%), and Immigrants from Senegal (5.2%, a difference of 0.41%).
| Demographics | Rating | Rank | Unemployment Among Ages 45 to 54 years |
| Africans | 0.0 /100 | #282 | Tragic 5.1% |
| Hispanics or Latinos | 0.0 /100 | #283 | Tragic 5.1% |
| Kiowa | 0.0 /100 | #284 | Tragic 5.1% |
| Iroquois | 0.0 /100 | #285 | Tragic 5.1% |
| Senegalese | 0.0 /100 | #286 | Tragic 5.1% |
| Haitians | 0.0 /100 | #287 | Tragic 5.2% |
| Immigrants | Caribbean | 0.0 /100 | #288 | Tragic 5.2% |
| Immigrants | Haiti | 0.0 /100 | #289 | Tragic 5.2% |
| Immigrants | Portugal | 0.0 /100 | #290 | Tragic 5.2% |
| Armenians | 0.0 /100 | #291 | Tragic 5.2% |
| Trinidadians and Tobagonians | 0.0 /100 | #292 | Tragic 5.2% |
| Immigrants | Senegal | 0.0 /100 | #293 | Tragic 5.2% |
| Belizeans | 0.0 /100 | #294 | Tragic 5.2% |
| Jamaicans | 0.0 /100 | #295 | Tragic 5.3% |
| Aleuts | 0.0 /100 | #296 | Tragic 5.3% |
Demographics Similar to Lebanese by Unemployment Among Ages 45 to 54 years
In terms of unemployment among ages 45 to 54 years, the demographic groups most similar to Lebanese are Immigrants from Congo (4.4%, a difference of 0.010%), Immigrants from Kuwait (4.4%, a difference of 0.020%), Immigrants from Zaire (4.4%, a difference of 0.10%), Immigrants from Middle Africa (4.4%, a difference of 0.12%), and Immigrants from Eastern Asia (4.4%, a difference of 0.17%).
| Demographics | Rating | Rank | Unemployment Among Ages 45 to 54 years |
| Celtics | 86.2 /100 | #130 | Excellent 4.4% |
| Immigrants | Germany | 85.9 /100 | #131 | Excellent 4.4% |
| Immigrants | Eastern Africa | 85.1 /100 | #132 | Excellent 4.4% |
| Immigrants | Cameroon | 84.8 /100 | #133 | Excellent 4.4% |
| Afghans | 84.6 /100 | #134 | Excellent 4.4% |
| Immigrants | Eastern Asia | 84.0 /100 | #135 | Excellent 4.4% |
| Immigrants | Middle Africa | 83.3 /100 | #136 | Excellent 4.4% |
| Lebanese | 81.9 /100 | #137 | Excellent 4.4% |
| Immigrants | Congo | 81.8 /100 | #138 | Excellent 4.4% |
| Immigrants | Kuwait | 81.7 /100 | #139 | Excellent 4.4% |
| Immigrants | Zaire | 80.7 /100 | #140 | Excellent 4.4% |
| Immigrants | Afghanistan | 79.6 /100 | #141 | Good 4.4% |
| Immigrants | Netherlands | 79.4 /100 | #142 | Good 4.4% |
| Macedonians | 79.0 /100 | #143 | Good 4.5% |
| Taiwanese | 77.9 /100 | #144 | Good 4.5% |