Slovene vs Afghan Unemployment Among Youth under 25 years
COMPARE
Slovene
Afghan
Unemployment Among Youth under 25 years
Unemployment Among Youth under 25 years Comparison
Slovenes
Afghans
10.7%
UNEMPLOYMENT AMONG YOUTH UNDER 25 YEARS
99.9/ 100
METRIC RATING
31st/ 347
METRIC RANK
11.3%
UNEMPLOYMENT AMONG YOUTH UNDER 25 YEARS
89.7/ 100
METRIC RATING
118th/ 347
METRIC RANK
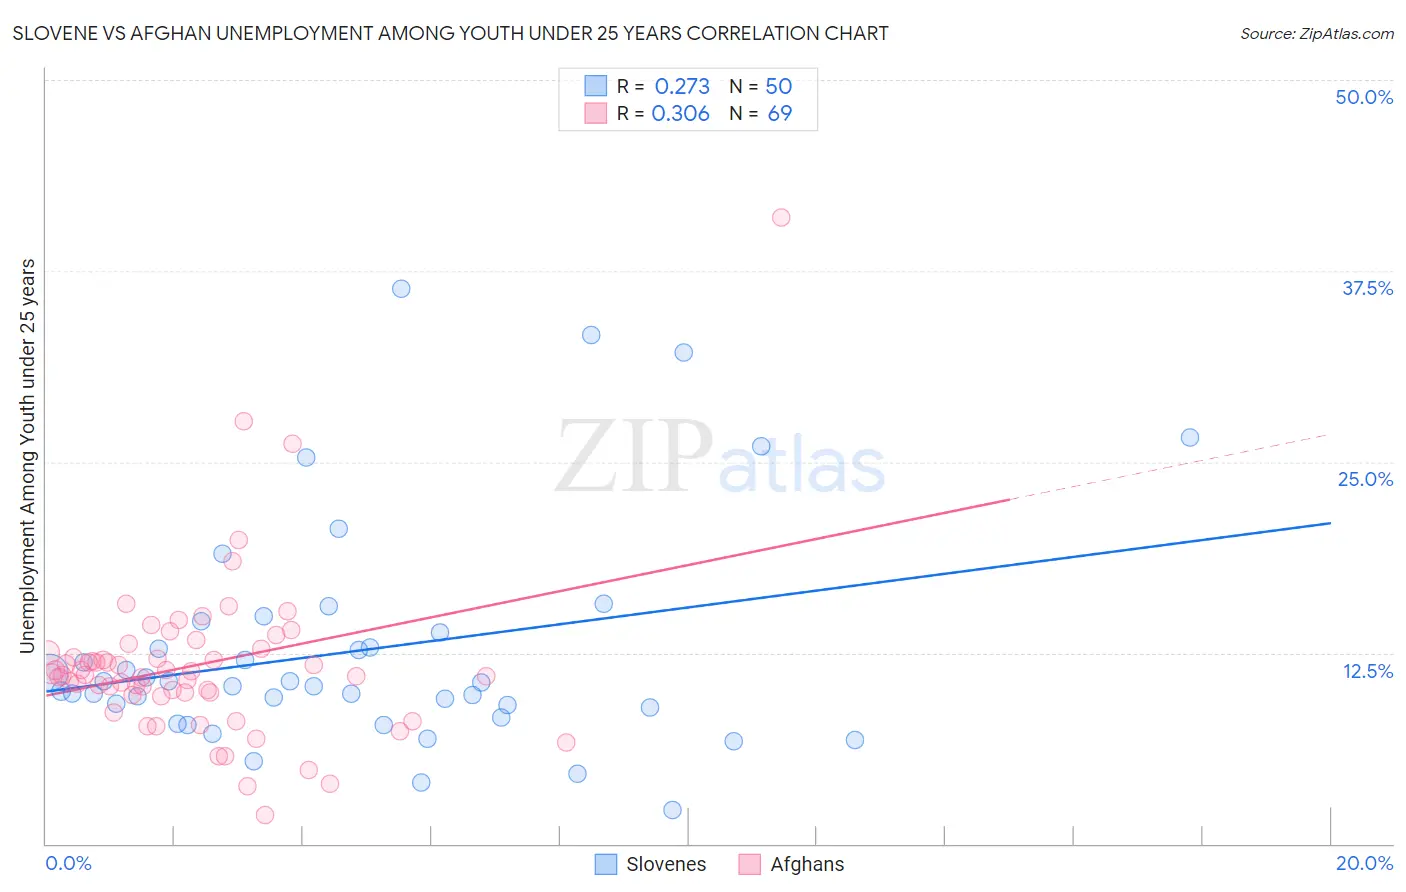
Slovene vs Afghan Unemployment Among Youth under 25 years Correlation Chart
The statistical analysis conducted on geographies consisting of 258,426,260 people shows a weak positive correlation between the proportion of Slovenes and unemployment rate among youth under the age of 25 in the United States with a correlation coefficient (R) of 0.273 and weighted average of 10.7%. Similarly, the statistical analysis conducted on geographies consisting of 148,562,433 people shows a mild positive correlation between the proportion of Afghans and unemployment rate among youth under the age of 25 in the United States with a correlation coefficient (R) of 0.306 and weighted average of 11.3%, a difference of 5.8%.
Unemployment Among Youth under 25 years Correlation Summary
| Measurement | Slovene | Afghan |
| Minimum | 2.2% | 1.9% |
| Maximum | 36.3% | 41.0% |
| Range | 34.1% | 39.1% |
| Mean | 12.7% | 11.7% |
| Median | 10.4% | 11.1% |
| Interquartile 25% (IQ1) | 8.9% | 9.8% |
| Interquartile 75% (IQ3) | 13.8% | 12.6% |
| Interquartile Range (IQR) | 4.9% | 2.8% |
| Standard Deviation (Sample) | 7.4% | 5.5% |
| Standard Deviation (Population) | 7.3% | 5.5% |
Similar Demographics by Unemployment Among Youth under 25 years
Demographics Similar to Slovenes by Unemployment Among Youth under 25 years
In terms of unemployment among youth under 25 years, the demographic groups most similar to Slovenes are Osage (10.7%, a difference of 0.11%), Chinese (10.7%, a difference of 0.18%), Taiwanese (10.8%, a difference of 0.26%), European (10.8%, a difference of 0.48%), and Somali (10.7%, a difference of 0.52%).
| Demographics | Rating | Rank | Unemployment Among Youth under 25 years |
| Finns | 100.0 /100 | #24 | Exceptional 10.7% |
| Immigrants | North Macedonia | 100.0 /100 | #25 | Exceptional 10.7% |
| Immigrants | India | 100.0 /100 | #26 | Exceptional 10.7% |
| Yugoslavians | 100.0 /100 | #27 | Exceptional 10.7% |
| Somalis | 100.0 /100 | #28 | Exceptional 10.7% |
| Chinese | 99.9 /100 | #29 | Exceptional 10.7% |
| Osage | 99.9 /100 | #30 | Exceptional 10.7% |
| Slovenes | 99.9 /100 | #31 | Exceptional 10.7% |
| Taiwanese | 99.9 /100 | #32 | Exceptional 10.8% |
| Europeans | 99.9 /100 | #33 | Exceptional 10.8% |
| English | 99.9 /100 | #34 | Exceptional 10.8% |
| Immigrants | Nepal | 99.9 /100 | #35 | Exceptional 10.8% |
| Hmong | 99.8 /100 | #36 | Exceptional 10.8% |
| Immigrants | Zimbabwe | 99.8 /100 | #37 | Exceptional 10.8% |
| Immigrants | Congo | 99.8 /100 | #38 | Exceptional 10.9% |
Demographics Similar to Afghans by Unemployment Among Youth under 25 years
In terms of unemployment among youth under 25 years, the demographic groups most similar to Afghans are Burmese (11.3%, a difference of 0.010%), Sri Lankan (11.3%, a difference of 0.010%), Immigrants from Vietnam (11.3%, a difference of 0.020%), Immigrants from Ethiopia (11.3%, a difference of 0.030%), and Immigrants from Scotland (11.4%, a difference of 0.050%).
| Demographics | Rating | Rank | Unemployment Among Youth under 25 years |
| Immigrants | France | 90.3 /100 | #111 | Exceptional 11.3% |
| Immigrants | Austria | 90.3 /100 | #112 | Exceptional 11.3% |
| Fijians | 90.2 /100 | #113 | Exceptional 11.3% |
| Immigrants | Ethiopia | 89.9 /100 | #114 | Excellent 11.3% |
| Immigrants | Vietnam | 89.9 /100 | #115 | Excellent 11.3% |
| Burmese | 89.8 /100 | #116 | Excellent 11.3% |
| Sri Lankans | 89.8 /100 | #117 | Excellent 11.3% |
| Afghans | 89.7 /100 | #118 | Excellent 11.3% |
| Immigrants | Scotland | 89.2 /100 | #119 | Excellent 11.4% |
| Malaysians | 89.0 /100 | #120 | Excellent 11.4% |
| Slovaks | 88.9 /100 | #121 | Excellent 11.4% |
| Immigrants | Micronesia | 88.1 /100 | #122 | Excellent 11.4% |
| Basques | 87.8 /100 | #123 | Excellent 11.4% |
| Italians | 87.2 /100 | #124 | Excellent 11.4% |
| Immigrants | Argentina | 87.2 /100 | #125 | Excellent 11.4% |