Slovene vs Afghan Single Mother Poverty
COMPARE
Slovene
Afghan
Single Mother Poverty
Single Mother Poverty Comparison
Slovenes
Afghans
28.8%
SINGLE MOTHER POVERTY
76.4/ 100
METRIC RATING
153rd/ 347
METRIC RANK
27.7%
SINGLE MOTHER POVERTY
98.5/ 100
METRIC RATING
87th/ 347
METRIC RANK
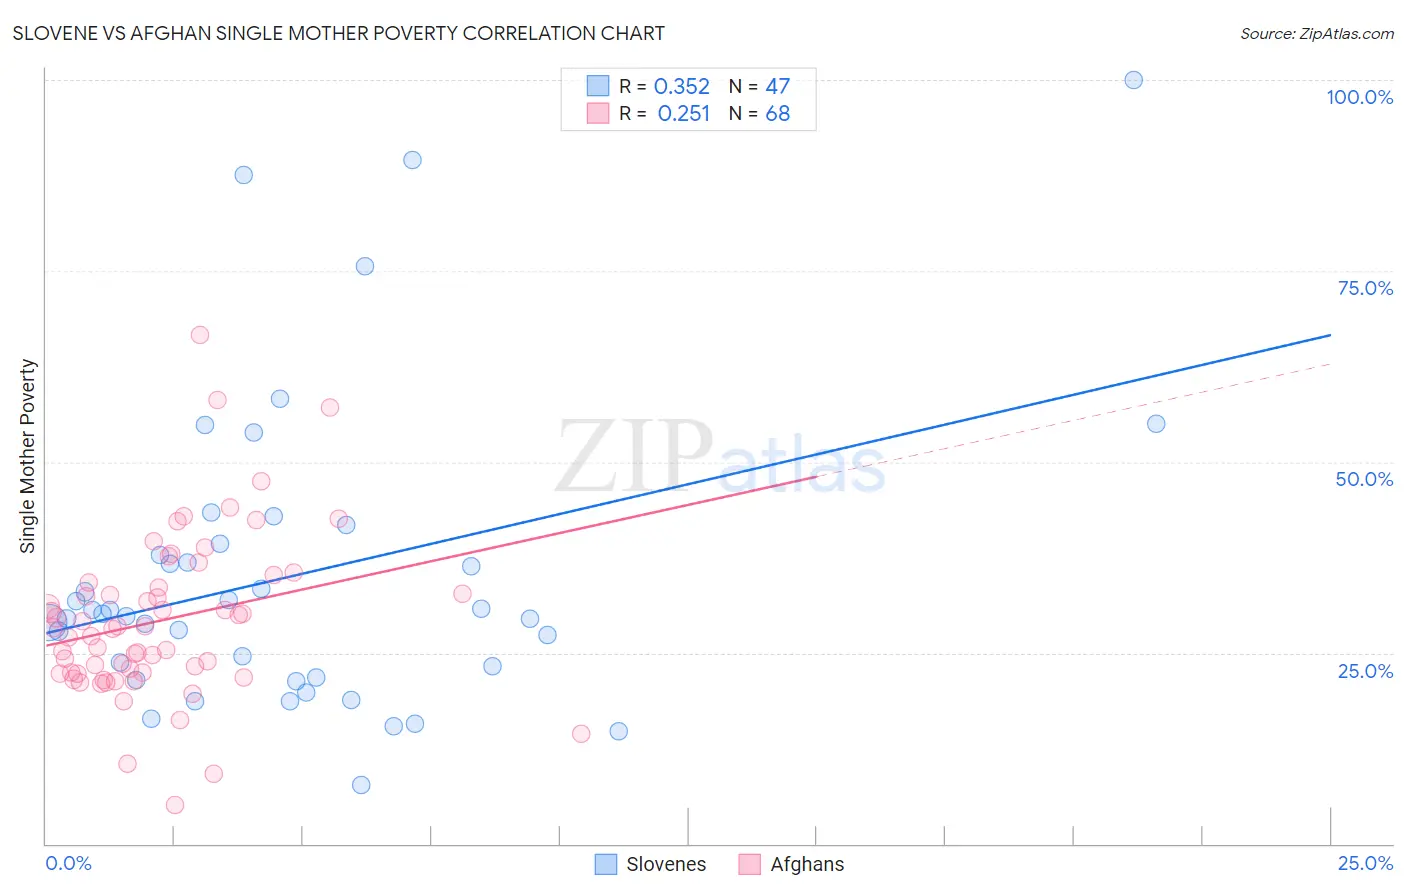
Slovene vs Afghan Single Mother Poverty Correlation Chart
The statistical analysis conducted on geographies consisting of 255,975,131 people shows a mild positive correlation between the proportion of Slovenes and poverty level among single mothers in the United States with a correlation coefficient (R) of 0.352 and weighted average of 28.8%. Similarly, the statistical analysis conducted on geographies consisting of 147,050,043 people shows a weak positive correlation between the proportion of Afghans and poverty level among single mothers in the United States with a correlation coefficient (R) of 0.251 and weighted average of 27.7%, a difference of 3.7%.
Single Mother Poverty Correlation Summary
| Measurement | Slovene | Afghan |
| Minimum | 7.7% | 5.1% |
| Maximum | 100.0% | 66.7% |
| Range | 92.3% | 61.5% |
| Mean | 35.2% | 29.3% |
| Median | 30.1% | 28.2% |
| Interquartile 25% (IQ1) | 21.7% | 22.4% |
| Interquartile 75% (IQ3) | 39.2% | 33.9% |
| Interquartile Range (IQR) | 17.5% | 11.6% |
| Standard Deviation (Sample) | 19.9% | 10.8% |
| Standard Deviation (Population) | 19.6% | 10.7% |
Similar Demographics by Single Mother Poverty
Demographics Similar to Slovenes by Single Mother Poverty
In terms of single mother poverty, the demographic groups most similar to Slovenes are Austrian (28.7%, a difference of 0.18%), Portuguese (28.8%, a difference of 0.21%), Immigrants from Oceania (28.7%, a difference of 0.25%), Ugandan (28.8%, a difference of 0.29%), and Iraqi (28.8%, a difference of 0.31%).
| Demographics | Rating | Rank | Single Mother Poverty |
| Immigrants | Denmark | 86.1 /100 | #146 | Excellent 28.5% |
| Immigrants | Lebanon | 85.3 /100 | #147 | Excellent 28.6% |
| Syrians | 85.3 /100 | #148 | Excellent 28.6% |
| Serbians | 85.0 /100 | #149 | Excellent 28.6% |
| Northern Europeans | 81.7 /100 | #150 | Excellent 28.6% |
| Immigrants | Oceania | 79.9 /100 | #151 | Good 28.7% |
| Austrians | 79.0 /100 | #152 | Good 28.7% |
| Slovenes | 76.4 /100 | #153 | Good 28.8% |
| Portuguese | 73.2 /100 | #154 | Good 28.8% |
| Ugandans | 71.7 /100 | #155 | Good 28.8% |
| Iraqis | 71.5 /100 | #156 | Good 28.8% |
| Immigrants | Western Europe | 71.1 /100 | #157 | Good 28.9% |
| Immigrants | Hungary | 70.6 /100 | #158 | Good 28.9% |
| Czechs | 68.4 /100 | #159 | Good 28.9% |
| Japanese | 68.0 /100 | #160 | Good 28.9% |
Demographics Similar to Afghans by Single Mother Poverty
In terms of single mother poverty, the demographic groups most similar to Afghans are Ethiopian (27.7%, a difference of 0.020%), Immigrants from Ethiopia (27.7%, a difference of 0.040%), Immigrants from Ukraine (27.7%, a difference of 0.10%), Mongolian (27.7%, a difference of 0.19%), and Immigrants from Latvia (27.7%, a difference of 0.20%).
| Demographics | Rating | Rank | Single Mother Poverty |
| Taiwanese | 99.1 /100 | #80 | Exceptional 27.5% |
| Immigrants | Scotland | 98.9 /100 | #81 | Exceptional 27.6% |
| Immigrants | Cameroon | 98.8 /100 | #82 | Exceptional 27.6% |
| Greeks | 98.7 /100 | #83 | Exceptional 27.7% |
| Immigrants | Latvia | 98.7 /100 | #84 | Exceptional 27.7% |
| Mongolians | 98.7 /100 | #85 | Exceptional 27.7% |
| Immigrants | Ukraine | 98.6 /100 | #86 | Exceptional 27.7% |
| Afghans | 98.5 /100 | #87 | Exceptional 27.7% |
| Ethiopians | 98.4 /100 | #88 | Exceptional 27.7% |
| Immigrants | Ethiopia | 98.4 /100 | #89 | Exceptional 27.7% |
| Immigrants | France | 98.2 /100 | #90 | Exceptional 27.8% |
| Immigrants | Albania | 98.0 /100 | #91 | Exceptional 27.8% |
| Estonians | 97.9 /100 | #92 | Exceptional 27.8% |
| Romanians | 97.8 /100 | #93 | Exceptional 27.8% |
| Albanians | 97.6 /100 | #94 | Exceptional 27.9% |