Immigrants from Micronesia vs Afghan Unemployment Among Youth under 25 years
COMPARE
Immigrants from Micronesia
Afghan
Unemployment Among Youth under 25 years
Unemployment Among Youth under 25 years Comparison
Immigrants from Micronesia
Afghans
11.4%
UNEMPLOYMENT AMONG YOUTH UNDER 25 YEARS
88.1/ 100
METRIC RATING
122nd/ 347
METRIC RANK
11.3%
UNEMPLOYMENT AMONG YOUTH UNDER 25 YEARS
89.7/ 100
METRIC RATING
118th/ 347
METRIC RANK
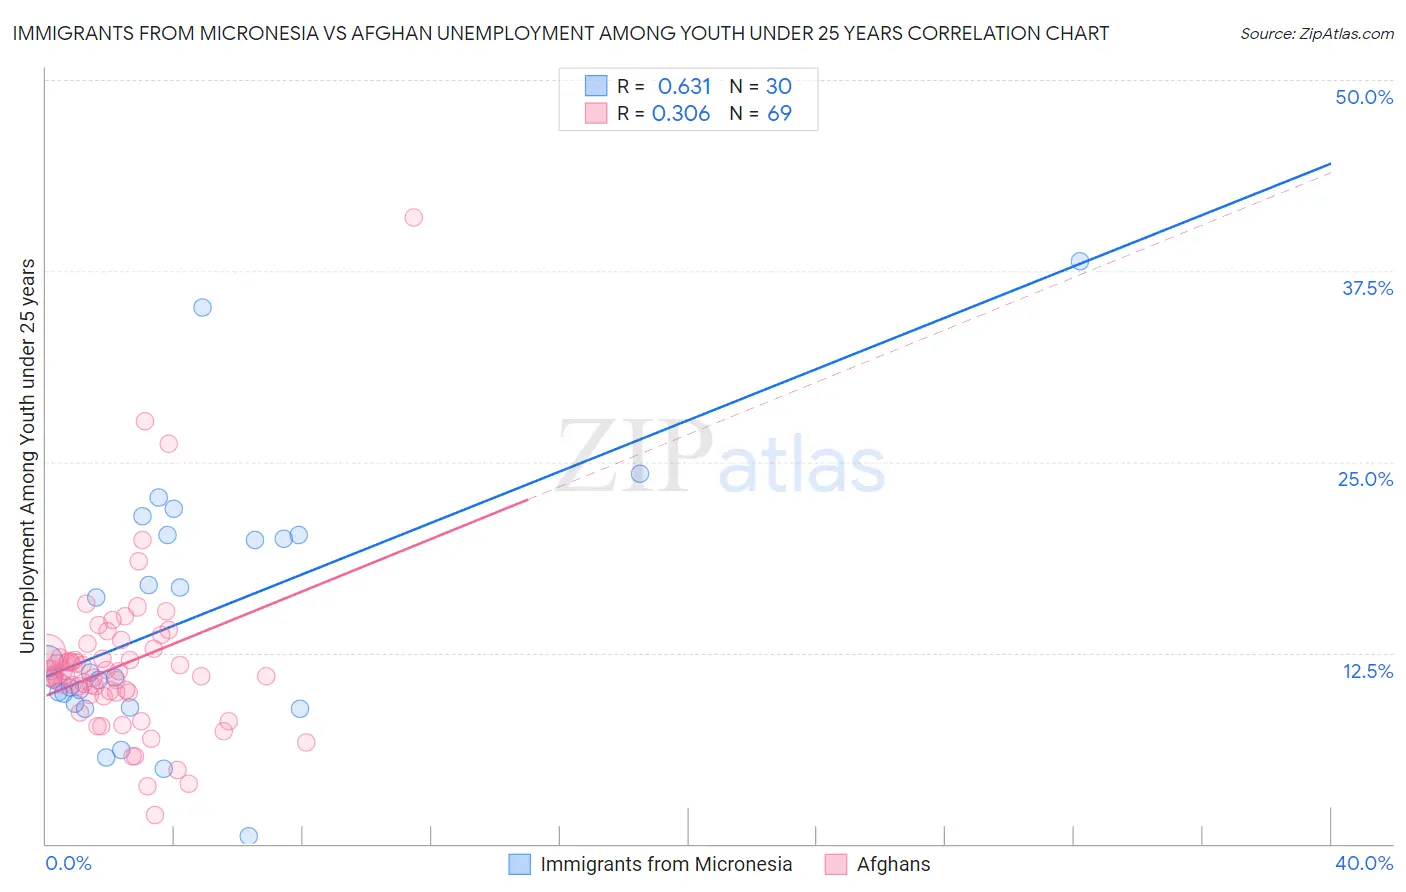
Immigrants from Micronesia vs Afghan Unemployment Among Youth under 25 years Correlation Chart
The statistical analysis conducted on geographies consisting of 61,437,718 people shows a significant positive correlation between the proportion of Immigrants from Micronesia and unemployment rate among youth under the age of 25 in the United States with a correlation coefficient (R) of 0.631 and weighted average of 11.4%. Similarly, the statistical analysis conducted on geographies consisting of 148,562,433 people shows a mild positive correlation between the proportion of Afghans and unemployment rate among youth under the age of 25 in the United States with a correlation coefficient (R) of 0.306 and weighted average of 11.3%, a difference of 0.17%.
Unemployment Among Youth under 25 years Correlation Summary
| Measurement | Immigrants from Micronesia | Afghan |
| Minimum | 0.50% | 1.9% |
| Maximum | 38.1% | 41.0% |
| Range | 37.6% | 39.1% |
| Mean | 14.7% | 11.7% |
| Median | 11.1% | 11.1% |
| Interquartile 25% (IQ1) | 9.2% | 9.8% |
| Interquartile 75% (IQ3) | 20.2% | 12.6% |
| Interquartile Range (IQR) | 11.0% | 2.8% |
| Standard Deviation (Sample) | 8.5% | 5.5% |
| Standard Deviation (Population) | 8.3% | 5.5% |
Demographics Similar to Immigrants from Micronesia and Afghans by Unemployment Among Youth under 25 years
In terms of unemployment among youth under 25 years, the demographic groups most similar to Immigrants from Micronesia are Basque (11.4%, a difference of 0.020%), Slovak (11.4%, a difference of 0.080%), Malaysian (11.4%, a difference of 0.090%), Italian (11.4%, a difference of 0.090%), and Immigrants from Argentina (11.4%, a difference of 0.090%). Similarly, the demographic groups most similar to Afghans are Burmese (11.3%, a difference of 0.010%), Sri Lankan (11.3%, a difference of 0.010%), Immigrants from Vietnam (11.3%, a difference of 0.020%), Immigrants from Ethiopia (11.3%, a difference of 0.030%), and Immigrants from Scotland (11.4%, a difference of 0.050%).
| Demographics | Rating | Rank | Unemployment Among Youth under 25 years |
| Immigrants | Norway | 91.5 /100 | #110 | Exceptional 11.3% |
| Immigrants | France | 90.3 /100 | #111 | Exceptional 11.3% |
| Immigrants | Austria | 90.3 /100 | #112 | Exceptional 11.3% |
| Fijians | 90.2 /100 | #113 | Exceptional 11.3% |
| Immigrants | Ethiopia | 89.9 /100 | #114 | Excellent 11.3% |
| Immigrants | Vietnam | 89.9 /100 | #115 | Excellent 11.3% |
| Burmese | 89.8 /100 | #116 | Excellent 11.3% |
| Sri Lankans | 89.8 /100 | #117 | Excellent 11.3% |
| Afghans | 89.7 /100 | #118 | Excellent 11.3% |
| Immigrants | Scotland | 89.2 /100 | #119 | Excellent 11.4% |
| Malaysians | 89.0 /100 | #120 | Excellent 11.4% |
| Slovaks | 88.9 /100 | #121 | Excellent 11.4% |
| Immigrants | Micronesia | 88.1 /100 | #122 | Excellent 11.4% |
| Basques | 87.8 /100 | #123 | Excellent 11.4% |
| Italians | 87.2 /100 | #124 | Excellent 11.4% |
| Immigrants | Argentina | 87.2 /100 | #125 | Excellent 11.4% |
| Canadians | 86.6 /100 | #126 | Excellent 11.4% |
| Greeks | 86.2 /100 | #127 | Excellent 11.4% |
| Immigrants | Hungary | 86.0 /100 | #128 | Excellent 11.4% |
| Turks | 85.8 /100 | #129 | Excellent 11.4% |
| Hungarians | 85.7 /100 | #130 | Excellent 11.4% |