Immigrants from Japan vs Immigrants from Afghanistan Unemployment Among Ages 45 to 54 years
COMPARE
Immigrants from Japan
Immigrants from Afghanistan
Unemployment Among Ages 45 to 54 years
Unemployment Among Ages 45 to 54 years Comparison
Immigrants from Japan
Immigrants from Afghanistan
4.3%
UNEMPLOYMENT AMONG AGES 45 TO 54 YEARS
98.7/ 100
METRIC RATING
69th/ 347
METRIC RANK
4.4%
UNEMPLOYMENT AMONG AGES 45 TO 54 YEARS
79.6/ 100
METRIC RATING
141st/ 347
METRIC RANK
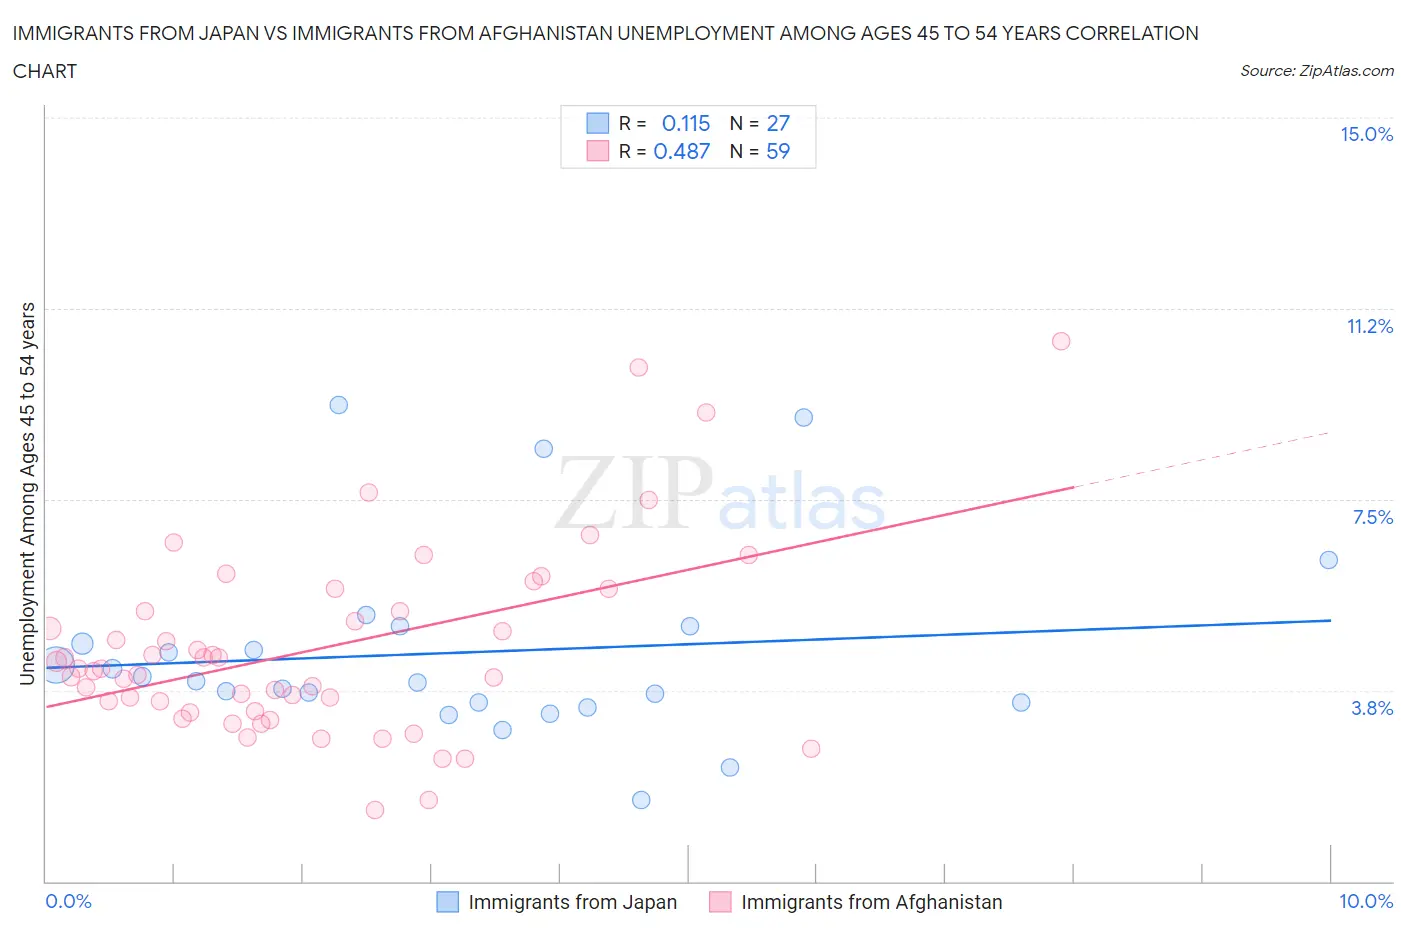
Immigrants from Japan vs Immigrants from Afghanistan Unemployment Among Ages 45 to 54 years Correlation Chart
The statistical analysis conducted on geographies consisting of 333,627,304 people shows a poor positive correlation between the proportion of Immigrants from Japan and unemployment rate among population between the ages 45 and 54 in the United States with a correlation coefficient (R) of 0.115 and weighted average of 4.3%. Similarly, the statistical analysis conducted on geographies consisting of 146,637,469 people shows a moderate positive correlation between the proportion of Immigrants from Afghanistan and unemployment rate among population between the ages 45 and 54 in the United States with a correlation coefficient (R) of 0.487 and weighted average of 4.4%, a difference of 3.7%.
Unemployment Among Ages 45 to 54 years Correlation Summary
| Measurement | Immigrants from Japan | Immigrants from Afghanistan |
| Minimum | 1.6% | 1.4% |
| Maximum | 9.4% | 10.6% |
| Range | 7.8% | 9.2% |
| Mean | 4.5% | 4.6% |
| Median | 3.9% | 4.2% |
| Interquartile 25% (IQ1) | 3.5% | 3.3% |
| Interquartile 75% (IQ3) | 5.0% | 5.3% |
| Interquartile Range (IQR) | 1.5% | 2.0% |
| Standard Deviation (Sample) | 1.9% | 1.8% |
| Standard Deviation (Population) | 1.8% | 1.8% |
Similar Demographics by Unemployment Among Ages 45 to 54 years
Demographics Similar to Immigrants from Japan by Unemployment Among Ages 45 to 54 years
In terms of unemployment among ages 45 to 54 years, the demographic groups most similar to Immigrants from Japan are Slovak (4.3%, a difference of 0.13%), Paraguayan (4.3%, a difference of 0.14%), Immigrants from Nepal (4.3%, a difference of 0.20%), Turkish (4.3%, a difference of 0.22%), and Palestinian (4.3%, a difference of 0.22%).
| Demographics | Rating | Rank | Unemployment Among Ages 45 to 54 years |
| Lithuanians | 99.1 /100 | #62 | Exceptional 4.3% |
| Pennsylvania Germans | 99.1 /100 | #63 | Exceptional 4.3% |
| Austrians | 99.0 /100 | #64 | Exceptional 4.3% |
| Immigrants | Sudan | 99.0 /100 | #65 | Exceptional 4.3% |
| Turks | 98.9 /100 | #66 | Exceptional 4.3% |
| Immigrants | Nepal | 98.9 /100 | #67 | Exceptional 4.3% |
| Slovaks | 98.8 /100 | #68 | Exceptional 4.3% |
| Immigrants | Japan | 98.7 /100 | #69 | Exceptional 4.3% |
| Paraguayans | 98.6 /100 | #70 | Exceptional 4.3% |
| Palestinians | 98.5 /100 | #71 | Exceptional 4.3% |
| Whites/Caucasians | 98.4 /100 | #72 | Exceptional 4.3% |
| Canadians | 98.2 /100 | #73 | Exceptional 4.3% |
| Immigrants | Belgium | 98.2 /100 | #74 | Exceptional 4.3% |
| Kenyans | 98.1 /100 | #75 | Exceptional 4.3% |
| Slavs | 98.1 /100 | #76 | Exceptional 4.3% |
Demographics Similar to Immigrants from Afghanistan by Unemployment Among Ages 45 to 54 years
In terms of unemployment among ages 45 to 54 years, the demographic groups most similar to Immigrants from Afghanistan are Immigrants from Netherlands (4.4%, a difference of 0.020%), Macedonian (4.5%, a difference of 0.040%), Immigrants from Zaire (4.4%, a difference of 0.080%), Taiwanese (4.5%, a difference of 0.12%), and Immigrants from Latvia (4.5%, a difference of 0.15%).
| Demographics | Rating | Rank | Unemployment Among Ages 45 to 54 years |
| Afghans | 84.6 /100 | #134 | Excellent 4.4% |
| Immigrants | Eastern Asia | 84.0 /100 | #135 | Excellent 4.4% |
| Immigrants | Middle Africa | 83.3 /100 | #136 | Excellent 4.4% |
| Lebanese | 81.9 /100 | #137 | Excellent 4.4% |
| Immigrants | Congo | 81.8 /100 | #138 | Excellent 4.4% |
| Immigrants | Kuwait | 81.7 /100 | #139 | Excellent 4.4% |
| Immigrants | Zaire | 80.7 /100 | #140 | Excellent 4.4% |
| Immigrants | Afghanistan | 79.6 /100 | #141 | Good 4.4% |
| Immigrants | Netherlands | 79.4 /100 | #142 | Good 4.4% |
| Macedonians | 79.0 /100 | #143 | Good 4.5% |
| Taiwanese | 77.9 /100 | #144 | Good 4.5% |
| Immigrants | Latvia | 77.5 /100 | #145 | Good 4.5% |
| Syrians | 77.3 /100 | #146 | Good 4.5% |
| Uruguayans | 76.9 /100 | #147 | Good 4.5% |
| Immigrants | Austria | 75.3 /100 | #148 | Good 4.5% |