Sioux vs Sri Lankan Unemployment Among Seniors over 75 years
COMPARE
Sioux
Sri Lankan
Unemployment Among Seniors over 75 years
Unemployment Among Seniors over 75 years Comparison
Sioux
Sri Lankans
9.7%
UNEMPLOYMENT AMONG SENIORS OVER 75 YEARS
0.0/ 100
METRIC RATING
290th/ 347
METRIC RANK
8.2%
UNEMPLOYMENT AMONG SENIORS OVER 75 YEARS
98.9/ 100
METRIC RATING
107th/ 347
METRIC RANK
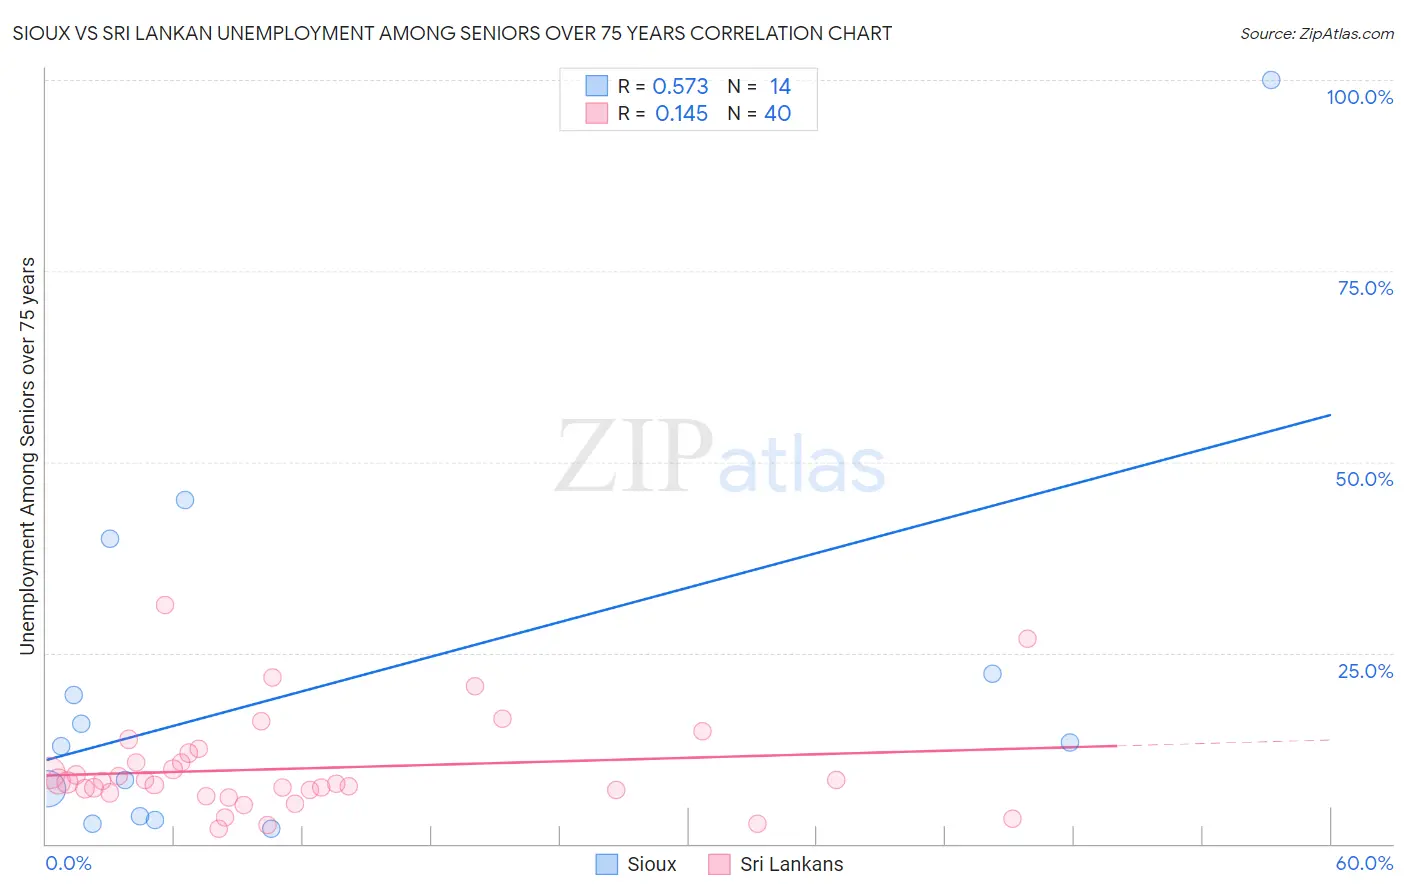
Sioux vs Sri Lankan Unemployment Among Seniors over 75 years Correlation Chart
The statistical analysis conducted on geographies consisting of 135,333,642 people shows a substantial positive correlation between the proportion of Sioux and unemployment rate among seniors over the age of 75 in the United States with a correlation coefficient (R) of 0.573 and weighted average of 9.7%. Similarly, the statistical analysis conducted on geographies consisting of 213,313,505 people shows a poor positive correlation between the proportion of Sri Lankans and unemployment rate among seniors over the age of 75 in the United States with a correlation coefficient (R) of 0.145 and weighted average of 8.2%, a difference of 18.1%.
Unemployment Among Seniors over 75 years Correlation Summary
| Measurement | Sioux | Sri Lankan |
| Minimum | 1.9% | 2.0% |
| Maximum | 100.0% | 31.3% |
| Range | 98.1% | 29.3% |
| Mean | 21.1% | 9.9% |
| Median | 13.0% | 8.1% |
| Interquartile 25% (IQ1) | 3.6% | 6.8% |
| Interquartile 75% (IQ3) | 22.2% | 11.3% |
| Interquartile Range (IQR) | 18.6% | 4.5% |
| Standard Deviation (Sample) | 26.3% | 6.3% |
| Standard Deviation (Population) | 25.4% | 6.2% |
Similar Demographics by Unemployment Among Seniors over 75 years
Demographics Similar to Sioux by Unemployment Among Seniors over 75 years
In terms of unemployment among seniors over 75 years, the demographic groups most similar to Sioux are Czech (9.7%, a difference of 0.070%), Canadian (9.7%, a difference of 0.15%), Danish (9.7%, a difference of 0.29%), Scandinavian (9.7%, a difference of 0.38%), and Nigerian (9.7%, a difference of 0.40%).
| Demographics | Rating | Rank | Unemployment Among Seniors over 75 years |
| Immigrants | Nigeria | 0.0 /100 | #283 | Tragic 9.6% |
| Europeans | 0.0 /100 | #284 | Tragic 9.7% |
| Carpatho Rusyns | 0.0 /100 | #285 | Tragic 9.7% |
| Nigerians | 0.0 /100 | #286 | Tragic 9.7% |
| Danes | 0.0 /100 | #287 | Tragic 9.7% |
| Canadians | 0.0 /100 | #288 | Tragic 9.7% |
| Czechs | 0.0 /100 | #289 | Tragic 9.7% |
| Sioux | 0.0 /100 | #290 | Tragic 9.7% |
| Scandinavians | 0.0 /100 | #291 | Tragic 9.7% |
| Immigrants | Western Africa | 0.0 /100 | #292 | Tragic 9.8% |
| Norwegians | 0.0 /100 | #293 | Tragic 9.8% |
| Immigrants | Dominica | 0.0 /100 | #294 | Tragic 9.8% |
| Immigrants | Nonimmigrants | 0.0 /100 | #295 | Tragic 9.8% |
| Immigrants | St. Vincent and the Grenadines | 0.0 /100 | #296 | Tragic 9.8% |
| Cherokee | 0.0 /100 | #297 | Tragic 9.8% |
Demographics Similar to Sri Lankans by Unemployment Among Seniors over 75 years
In terms of unemployment among seniors over 75 years, the demographic groups most similar to Sri Lankans are Laotian (8.2%, a difference of 0.13%), Immigrants from Lebanon (8.2%, a difference of 0.15%), Immigrants from Caribbean (8.2%, a difference of 0.17%), Immigrants from Honduras (8.2%, a difference of 0.17%), and Marshallese (8.2%, a difference of 0.18%).
| Demographics | Rating | Rank | Unemployment Among Seniors over 75 years |
| Immigrants | Kazakhstan | 99.2 /100 | #100 | Exceptional 8.2% |
| Immigrants | Serbia | 99.2 /100 | #101 | Exceptional 8.2% |
| Immigrants | Panama | 99.1 /100 | #102 | Exceptional 8.2% |
| South American Indians | 99.1 /100 | #103 | Exceptional 8.2% |
| Immigrants | South Central Asia | 99.0 /100 | #104 | Exceptional 8.2% |
| Immigrants | Caribbean | 99.0 /100 | #105 | Exceptional 8.2% |
| Immigrants | Honduras | 99.0 /100 | #106 | Exceptional 8.2% |
| Sri Lankans | 98.9 /100 | #107 | Exceptional 8.2% |
| Laotians | 98.8 /100 | #108 | Exceptional 8.2% |
| Immigrants | Lebanon | 98.8 /100 | #109 | Exceptional 8.2% |
| Marshallese | 98.7 /100 | #110 | Exceptional 8.2% |
| French American Indians | 98.7 /100 | #111 | Exceptional 8.2% |
| Immigrants | India | 98.6 /100 | #112 | Exceptional 8.2% |
| Asians | 98.5 /100 | #113 | Exceptional 8.3% |
| Trinidadians and Tobagonians | 98.4 /100 | #114 | Exceptional 8.3% |