Lithuanian vs Arab Unemployment Among Ages 25 to 29 years
COMPARE
Lithuanian
Arab
Unemployment Among Ages 25 to 29 years
Unemployment Among Ages 25 to 29 years Comparison
Lithuanians
Arabs
6.5%
UNEMPLOYMENT AMONG AGES 25 TO 29 YEARS
72.2/ 100
METRIC RATING
143rd/ 347
METRIC RANK
6.5%
UNEMPLOYMENT AMONG AGES 25 TO 29 YEARS
82.5/ 100
METRIC RATING
124th/ 347
METRIC RANK
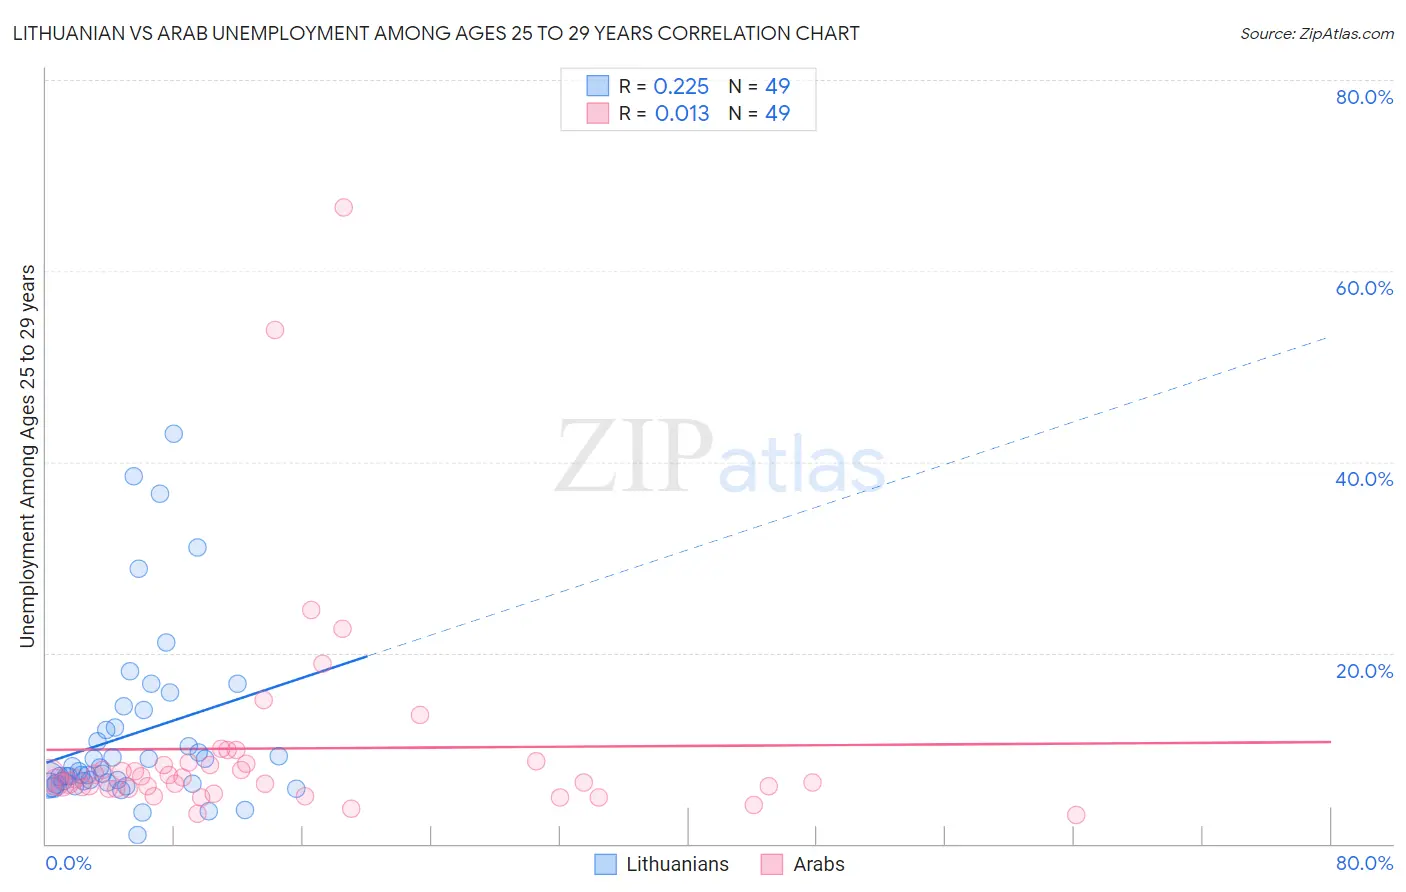
Lithuanian vs Arab Unemployment Among Ages 25 to 29 years Correlation Chart
The statistical analysis conducted on geographies consisting of 393,777,070 people shows a weak positive correlation between the proportion of Lithuanians and unemployment rate among population between the ages 25 and 29 in the United States with a correlation coefficient (R) of 0.225 and weighted average of 6.5%. Similarly, the statistical analysis conducted on geographies consisting of 454,763,852 people shows no correlation between the proportion of Arabs and unemployment rate among population between the ages 25 and 29 in the United States with a correlation coefficient (R) of 0.013 and weighted average of 6.5%, a difference of 0.94%.
Unemployment Among Ages 25 to 29 years Correlation Summary
| Measurement | Lithuanian | Arab |
| Minimum | 0.90% | 3.0% |
| Maximum | 42.9% | 66.7% |
| Range | 42.0% | 63.7% |
| Mean | 11.4% | 10.0% |
| Median | 7.6% | 6.8% |
| Interquartile 25% (IQ1) | 6.3% | 5.8% |
| Interquartile 75% (IQ3) | 13.1% | 8.4% |
| Interquartile Range (IQR) | 6.7% | 2.6% |
| Standard Deviation (Sample) | 9.3% | 11.4% |
| Standard Deviation (Population) | 9.2% | 11.3% |
Demographics Similar to Lithuanians and Arabs by Unemployment Among Ages 25 to 29 years
In terms of unemployment among ages 25 to 29 years, the demographic groups most similar to Lithuanians are Slavic (6.5%, a difference of 0.020%), Maltese (6.5%, a difference of 0.060%), Austrian (6.5%, a difference of 0.12%), Immigrants from Pakistan (6.5%, a difference of 0.12%), and Immigrants from Belgium (6.5%, a difference of 0.13%). Similarly, the demographic groups most similar to Arabs are Syrian (6.5%, a difference of 0.040%), Brazilian (6.5%, a difference of 0.060%), Laotian (6.5%, a difference of 0.12%), Dutch (6.5%, a difference of 0.19%), and Immigrants from Chile (6.5%, a difference of 0.21%).
| Demographics | Rating | Rank | Unemployment Among Ages 25 to 29 years |
| Laotians | 83.6 /100 | #123 | Excellent 6.5% |
| Arabs | 82.5 /100 | #124 | Excellent 6.5% |
| Syrians | 82.1 /100 | #125 | Excellent 6.5% |
| Brazilians | 81.9 /100 | #126 | Excellent 6.5% |
| Dutch | 80.6 /100 | #127 | Excellent 6.5% |
| Immigrants | Chile | 80.5 /100 | #128 | Excellent 6.5% |
| Sri Lankans | 80.3 /100 | #129 | Excellent 6.5% |
| Immigrants | Peru | 79.9 /100 | #130 | Good 6.5% |
| Immigrants | Afghanistan | 79.2 /100 | #131 | Good 6.5% |
| Poles | 76.6 /100 | #132 | Good 6.5% |
| Immigrants | Europe | 75.7 /100 | #133 | Good 6.5% |
| Immigrants | Vietnam | 75.6 /100 | #134 | Good 6.5% |
| Immigrants | Croatia | 75.5 /100 | #135 | Good 6.5% |
| Northern Europeans | 75.4 /100 | #136 | Good 6.5% |
| Eastern Europeans | 74.1 /100 | #137 | Good 6.5% |
| Immigrants | Belgium | 73.8 /100 | #138 | Good 6.5% |
| Austrians | 73.8 /100 | #139 | Good 6.5% |
| Immigrants | Pakistan | 73.8 /100 | #140 | Good 6.5% |
| Maltese | 72.9 /100 | #141 | Good 6.5% |
| Slavs | 72.5 /100 | #142 | Good 6.5% |
| Lithuanians | 72.2 /100 | #143 | Good 6.5% |