Serbian vs Latvian Unemployment Among Seniors over 75 years
COMPARE
Serbian
Latvian
Unemployment Among Seniors over 75 years
Unemployment Among Seniors over 75 years Comparison
Serbians
Latvians
8.4%
UNEMPLOYMENT AMONG SENIORS OVER 75 YEARS
93.7/ 100
METRIC RATING
133rd/ 347
METRIC RANK
8.6%
UNEMPLOYMENT AMONG SENIORS OVER 75 YEARS
80.5/ 100
METRIC RATING
152nd/ 347
METRIC RANK
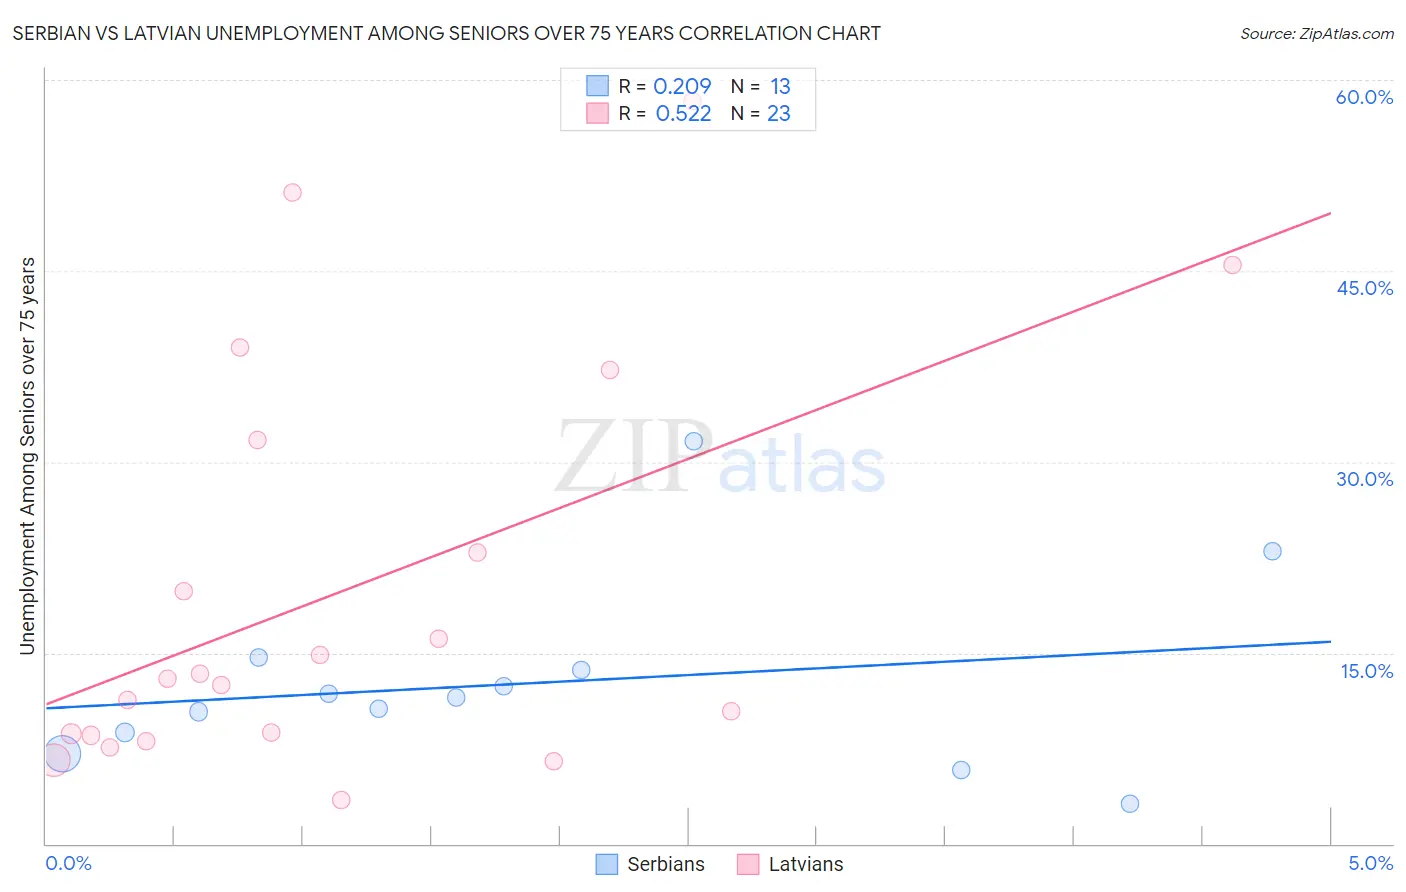
Serbian vs Latvian Unemployment Among Seniors over 75 years Correlation Chart
The statistical analysis conducted on geographies consisting of 156,247,498 people shows a weak positive correlation between the proportion of Serbians and unemployment rate among seniors over the age of 75 in the United States with a correlation coefficient (R) of 0.209 and weighted average of 8.4%. Similarly, the statistical analysis conducted on geographies consisting of 138,130,027 people shows a substantial positive correlation between the proportion of Latvians and unemployment rate among seniors over the age of 75 in the United States with a correlation coefficient (R) of 0.522 and weighted average of 8.6%, a difference of 1.8%.
Unemployment Among Seniors over 75 years Correlation Summary
| Measurement | Serbian | Latvian |
| Minimum | 3.1% | 3.4% |
| Maximum | 31.6% | 58.3% |
| Range | 28.5% | 54.9% |
| Mean | 12.6% | 19.8% |
| Median | 11.5% | 13.0% |
| Interquartile 25% (IQ1) | 7.9% | 8.5% |
| Interquartile 75% (IQ3) | 14.1% | 31.7% |
| Interquartile Range (IQR) | 6.3% | 23.2% |
| Standard Deviation (Sample) | 7.5% | 15.9% |
| Standard Deviation (Population) | 7.2% | 15.6% |
Demographics Similar to Serbians and Latvians by Unemployment Among Seniors over 75 years
In terms of unemployment among seniors over 75 years, the demographic groups most similar to Serbians are Chilean (8.4%, a difference of 0.030%), Immigrants from Czechoslovakia (8.4%, a difference of 0.080%), Haitian (8.5%, a difference of 0.47%), Immigrants from Trinidad and Tobago (8.5%, a difference of 0.58%), and Immigrants from Kuwait (8.5%, a difference of 0.62%). Similarly, the demographic groups most similar to Latvians are Immigrants from Bosnia and Herzegovina (8.6%, a difference of 0.010%), Paiute (8.6%, a difference of 0.18%), Immigrants from Ecuador (8.5%, a difference of 0.38%), Immigrants from Sierra Leone (8.5%, a difference of 0.50%), and Immigrants from Colombia (8.5%, a difference of 0.50%).
| Demographics | Rating | Rank | Unemployment Among Seniors over 75 years |
| Chileans | 93.8 /100 | #132 | Exceptional 8.4% |
| Serbians | 93.7 /100 | #133 | Exceptional 8.4% |
| Immigrants | Czechoslovakia | 93.4 /100 | #134 | Exceptional 8.4% |
| Haitians | 91.4 /100 | #135 | Exceptional 8.5% |
| Immigrants | Trinidad and Tobago | 90.8 /100 | #136 | Exceptional 8.5% |
| Immigrants | Kuwait | 90.5 /100 | #137 | Exceptional 8.5% |
| Immigrants | Bulgaria | 89.6 /100 | #138 | Excellent 8.5% |
| Barbadians | 88.6 /100 | #139 | Excellent 8.5% |
| South Americans | 87.9 /100 | #140 | Excellent 8.5% |
| Immigrants | Bolivia | 87.9 /100 | #141 | Excellent 8.5% |
| Immigrants | Ukraine | 87.0 /100 | #142 | Excellent 8.5% |
| Immigrants | Costa Rica | 86.8 /100 | #143 | Excellent 8.5% |
| Colombians | 86.7 /100 | #144 | Excellent 8.5% |
| Immigrants | Romania | 86.2 /100 | #145 | Excellent 8.5% |
| Immigrants | South Eastern Asia | 85.8 /100 | #146 | Excellent 8.5% |
| Immigrants | Sierra Leone | 85.6 /100 | #147 | Excellent 8.5% |
| Immigrants | Colombia | 85.6 /100 | #148 | Excellent 8.5% |
| Immigrants | Ecuador | 84.6 /100 | #149 | Excellent 8.5% |
| Paiute | 82.5 /100 | #150 | Excellent 8.6% |
| Immigrants | Bosnia and Herzegovina | 80.6 /100 | #151 | Excellent 8.6% |
| Latvians | 80.5 /100 | #152 | Excellent 8.6% |