Senegalese vs U.S. Virgin Islander Unemployment Among Ages 30 to 34 years
COMPARE
Senegalese
U.S. Virgin Islander
Unemployment Among Ages 30 to 34 years
Unemployment Among Ages 30 to 34 years Comparison
Senegalese
U.S. Virgin Islanders
6.4%
UNEMPLOYMENT AMONG AGES 30 TO 34 YEARS
0.0/ 100
METRIC RATING
288th/ 347
METRIC RANK
6.3%
UNEMPLOYMENT AMONG AGES 30 TO 34 YEARS
0.0/ 100
METRIC RATING
274th/ 347
METRIC RANK
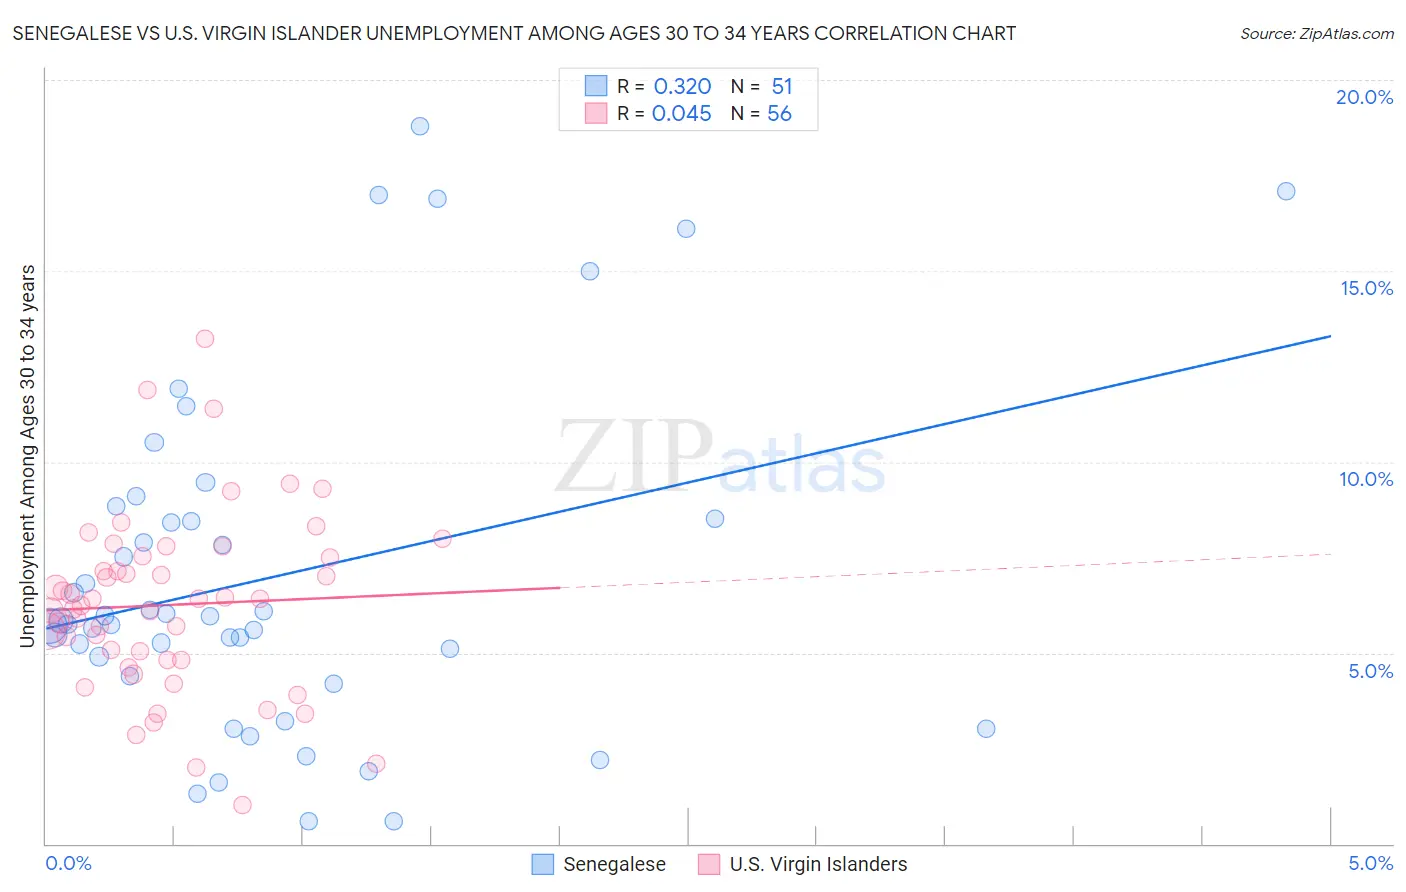
Senegalese vs U.S. Virgin Islander Unemployment Among Ages 30 to 34 years Correlation Chart
The statistical analysis conducted on geographies consisting of 77,308,775 people shows a mild positive correlation between the proportion of Senegalese and unemployment rate among population between the ages 30 and 34 in the United States with a correlation coefficient (R) of 0.320 and weighted average of 6.4%. Similarly, the statistical analysis conducted on geographies consisting of 86,615,171 people shows no correlation between the proportion of U.S. Virgin Islanders and unemployment rate among population between the ages 30 and 34 in the United States with a correlation coefficient (R) of 0.045 and weighted average of 6.3%, a difference of 2.5%.
Unemployment Among Ages 30 to 34 years Correlation Summary
| Measurement | Senegalese | U.S. Virgin Islander |
| Minimum | 0.60% | 1.0% |
| Maximum | 18.8% | 13.2% |
| Range | 18.2% | 12.2% |
| Mean | 7.0% | 6.3% |
| Median | 5.8% | 6.3% |
| Interquartile 25% (IQ1) | 4.4% | 4.8% |
| Interquartile 75% (IQ3) | 8.5% | 7.5% |
| Interquartile Range (IQR) | 4.1% | 2.7% |
| Standard Deviation (Sample) | 4.5% | 2.3% |
| Standard Deviation (Population) | 4.4% | 2.3% |
Demographics Similar to Senegalese and U.S. Virgin Islanders by Unemployment Among Ages 30 to 34 years
In terms of unemployment among ages 30 to 34 years, the demographic groups most similar to Senegalese are Immigrants from West Indies (6.4%, a difference of 0.040%), Menominee (6.4%, a difference of 0.040%), Central American Indian (6.4%, a difference of 0.060%), Choctaw (6.4%, a difference of 0.10%), and Immigrants from Bangladesh (6.4%, a difference of 0.20%). Similarly, the demographic groups most similar to U.S. Virgin Islanders are Ottawa (6.3%, a difference of 0.010%), Blackfeet (6.3%, a difference of 0.020%), Ecuadorian (6.3%, a difference of 0.10%), Comanche (6.3%, a difference of 0.13%), and Pennsylvania German (6.3%, a difference of 0.16%).
| Demographics | Rating | Rank | Unemployment Among Ages 30 to 34 years |
| Comanche | 0.0 /100 | #271 | Tragic 6.3% |
| Blackfeet | 0.0 /100 | #272 | Tragic 6.3% |
| Ottawa | 0.0 /100 | #273 | Tragic 6.3% |
| U.S. Virgin Islanders | 0.0 /100 | #274 | Tragic 6.3% |
| Ecuadorians | 0.0 /100 | #275 | Tragic 6.3% |
| Pennsylvania Germans | 0.0 /100 | #276 | Tragic 6.3% |
| Immigrants | Ecuador | 0.0 /100 | #277 | Tragic 6.3% |
| Osage | 0.0 /100 | #278 | Tragic 6.3% |
| Cree | 0.0 /100 | #279 | Tragic 6.4% |
| Cherokee | 0.0 /100 | #280 | Tragic 6.4% |
| Immigrants | Caribbean | 0.0 /100 | #281 | Tragic 6.4% |
| Africans | 0.0 /100 | #282 | Tragic 6.4% |
| Hispanics or Latinos | 0.0 /100 | #283 | Tragic 6.4% |
| Immigrants | Bangladesh | 0.0 /100 | #284 | Tragic 6.4% |
| Choctaw | 0.0 /100 | #285 | Tragic 6.4% |
| Central American Indians | 0.0 /100 | #286 | Tragic 6.4% |
| Immigrants | West Indies | 0.0 /100 | #287 | Tragic 6.4% |
| Senegalese | 0.0 /100 | #288 | Tragic 6.4% |
| Menominee | 0.0 /100 | #289 | Tragic 6.4% |
| Immigrants | Trinidad and Tobago | 0.0 /100 | #290 | Tragic 6.5% |
| Jamaicans | 0.0 /100 | #291 | Tragic 6.5% |