Chickasaw vs English Unemployment Among Ages 65 to 74 years
COMPARE
Chickasaw
English
Unemployment Among Ages 65 to 74 years
Unemployment Among Ages 65 to 74 years Comparison
Chickasaw
English
4.7%
UNEMPLOYMENT AMONG AGES 65 TO 74 YEARS
100.0/ 100
METRIC RATING
9th/ 347
METRIC RANK
5.2%
UNEMPLOYMENT AMONG AGES 65 TO 74 YEARS
97.8/ 100
METRIC RATING
89th/ 347
METRIC RANK
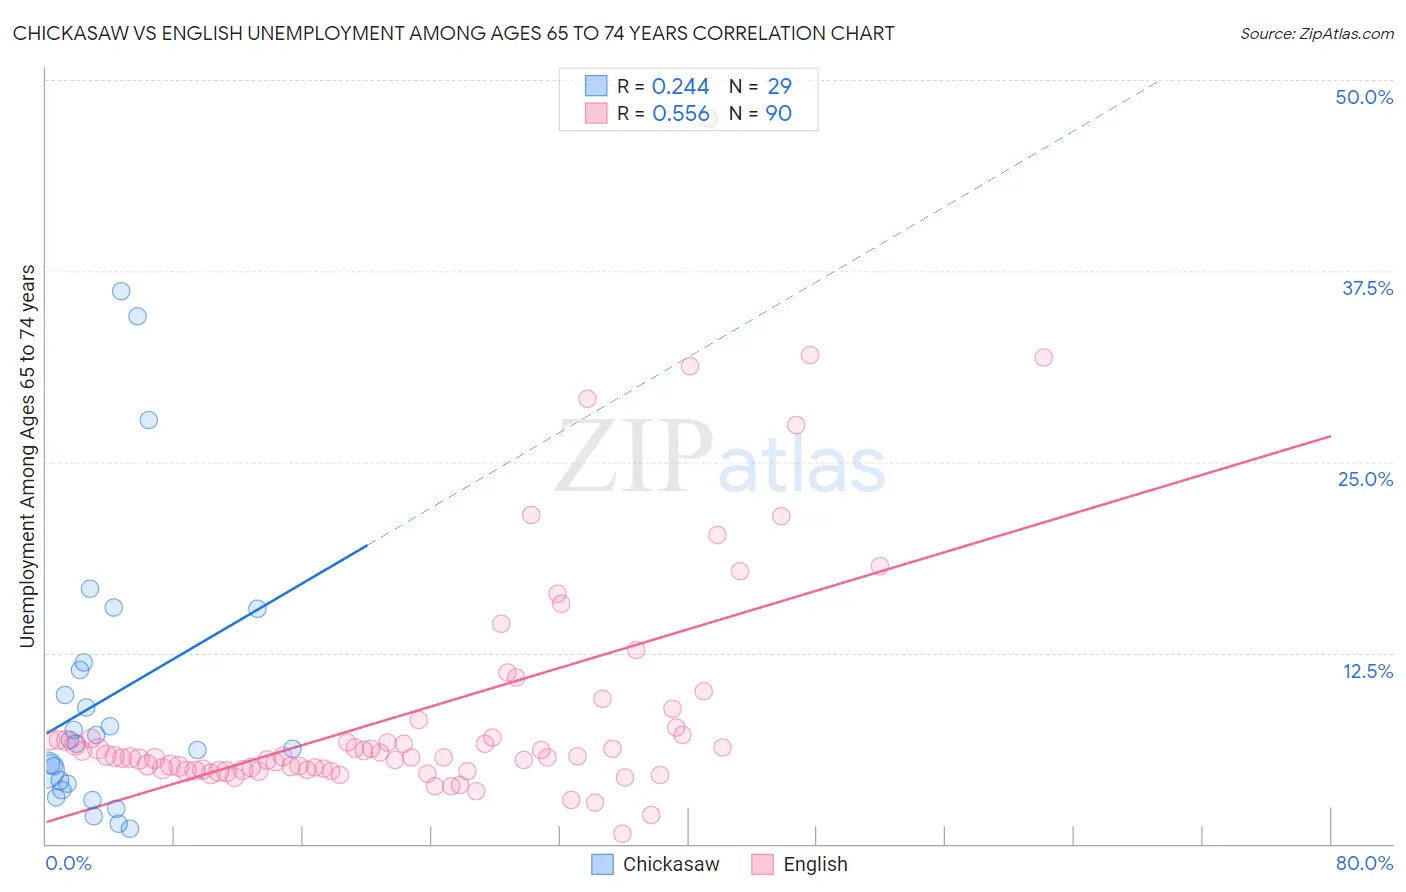
Chickasaw vs English Unemployment Among Ages 65 to 74 years Correlation Chart
The statistical analysis conducted on geographies consisting of 136,812,598 people shows a weak positive correlation between the proportion of Chickasaw and unemployment rate among population between the ages 65 and 74 in the United States with a correlation coefficient (R) of 0.244 and weighted average of 4.7%. Similarly, the statistical analysis conducted on geographies consisting of 447,132,305 people shows a substantial positive correlation between the proportion of English and unemployment rate among population between the ages 65 and 74 in the United States with a correlation coefficient (R) of 0.556 and weighted average of 5.2%, a difference of 10.2%.
Unemployment Among Ages 65 to 74 years Correlation Summary
| Measurement | Chickasaw | English |
| Minimum | 0.98% | 0.65% |
| Maximum | 36.2% | 47.5% |
| Range | 35.2% | 46.8% |
| Mean | 9.5% | 8.7% |
| Median | 6.6% | 5.7% |
| Interquartile 25% (IQ1) | 3.7% | 4.9% |
| Interquartile 75% (IQ3) | 11.6% | 7.1% |
| Interquartile Range (IQR) | 7.9% | 2.2% |
| Standard Deviation (Sample) | 9.1% | 7.9% |
| Standard Deviation (Population) | 9.0% | 7.9% |
Similar Demographics by Unemployment Among Ages 65 to 74 years
Demographics Similar to Chickasaw by Unemployment Among Ages 65 to 74 years
In terms of unemployment among ages 65 to 74 years, the demographic groups most similar to Chickasaw are Osage (4.7%, a difference of 0.11%), Comanche (4.7%, a difference of 0.26%), Indonesian (4.7%, a difference of 0.43%), Immigrants from Congo (4.7%, a difference of 0.52%), and Tongan (4.7%, a difference of 0.68%).
| Demographics | Rating | Rank | Unemployment Among Ages 65 to 74 years |
| Chinese | 100.0 /100 | #2 | Exceptional 4.4% |
| Fijians | 100.0 /100 | #3 | Exceptional 4.5% |
| Tsimshian | 100.0 /100 | #4 | Exceptional 4.6% |
| Sudanese | 100.0 /100 | #5 | Exceptional 4.6% |
| Immigrants | Cuba | 100.0 /100 | #6 | Exceptional 4.6% |
| Indonesians | 100.0 /100 | #7 | Exceptional 4.7% |
| Comanche | 100.0 /100 | #8 | Exceptional 4.7% |
| Chickasaw | 100.0 /100 | #9 | Exceptional 4.7% |
| Osage | 100.0 /100 | #10 | Exceptional 4.7% |
| Immigrants | Congo | 100.0 /100 | #11 | Exceptional 4.7% |
| Tongans | 100.0 /100 | #12 | Exceptional 4.7% |
| Lumbee | 100.0 /100 | #13 | Exceptional 4.8% |
| Cubans | 100.0 /100 | #14 | Exceptional 4.8% |
| Immigrants | North Macedonia | 100.0 /100 | #15 | Exceptional 4.8% |
| Immigrants | Burma/Myanmar | 100.0 /100 | #16 | Exceptional 4.8% |
Demographics Similar to English by Unemployment Among Ages 65 to 74 years
In terms of unemployment among ages 65 to 74 years, the demographic groups most similar to English are Immigrants from Saudi Arabia (5.2%, a difference of 0.010%), Danish (5.2%, a difference of 0.020%), Scottish (5.2%, a difference of 0.020%), British (5.2%, a difference of 0.030%), and Immigrants from Hungary (5.2%, a difference of 0.070%).
| Demographics | Rating | Rank | Unemployment Among Ages 65 to 74 years |
| Thais | 98.6 /100 | #82 | Exceptional 5.2% |
| Immigrants | Middle Africa | 98.4 /100 | #83 | Exceptional 5.2% |
| Immigrants | Hungary | 98.0 /100 | #84 | Exceptional 5.2% |
| British | 97.9 /100 | #85 | Exceptional 5.2% |
| Danes | 97.9 /100 | #86 | Exceptional 5.2% |
| Scottish | 97.9 /100 | #87 | Exceptional 5.2% |
| Immigrants | Saudi Arabia | 97.9 /100 | #88 | Exceptional 5.2% |
| English | 97.8 /100 | #89 | Exceptional 5.2% |
| Luxembourgers | 97.6 /100 | #90 | Exceptional 5.2% |
| Romanians | 97.4 /100 | #91 | Exceptional 5.2% |
| Puget Sound Salish | 97.3 /100 | #92 | Exceptional 5.2% |
| Immigrants | Netherlands | 97.1 /100 | #93 | Exceptional 5.2% |
| South Africans | 97.1 /100 | #94 | Exceptional 5.2% |
| Serbians | 97.0 /100 | #95 | Exceptional 5.2% |
| Immigrants | Thailand | 97.0 /100 | #96 | Exceptional 5.2% |