Samoan vs Yuman Unemployment Among Ages 20 to 24 years
COMPARE
Samoan
Yuman
Unemployment Among Ages 20 to 24 years
Unemployment Among Ages 20 to 24 years Comparison
Samoans
Yuman
10.3%
UNEMPLOYMENT AMONG AGES 20 TO 24 YEARS
45.4/ 100
METRIC RATING
175th/ 347
METRIC RANK
15.8%
UNEMPLOYMENT AMONG AGES 20 TO 24 YEARS
0.0/ 100
METRIC RATING
340th/ 347
METRIC RANK
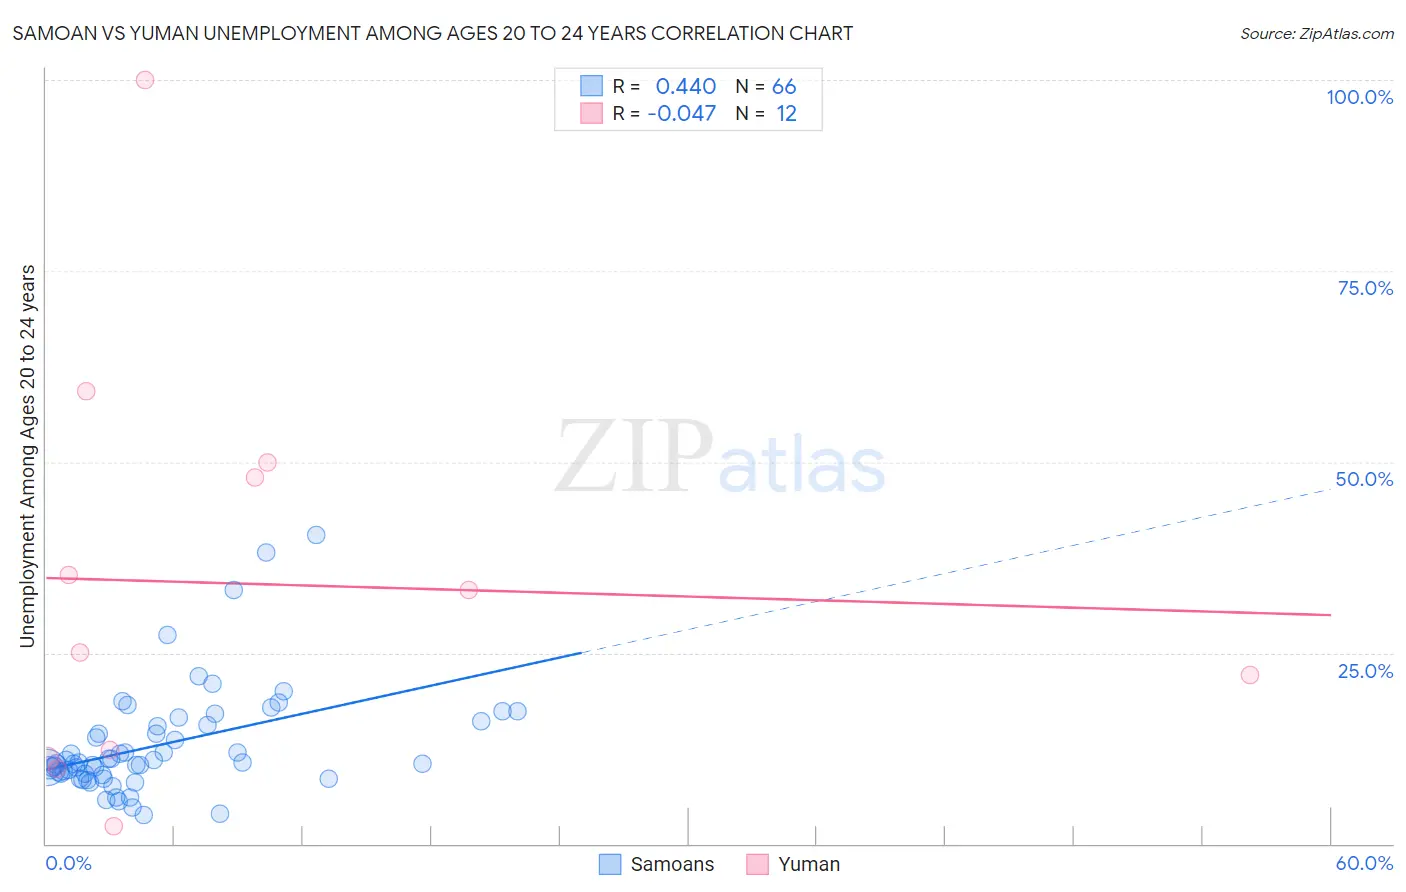
Samoan vs Yuman Unemployment Among Ages 20 to 24 years Correlation Chart
The statistical analysis conducted on geographies consisting of 221,635,604 people shows a moderate positive correlation between the proportion of Samoans and unemployment rate among population between the ages 20 and 24 in the United States with a correlation coefficient (R) of 0.440 and weighted average of 10.3%. Similarly, the statistical analysis conducted on geographies consisting of 40,517,674 people shows no correlation between the proportion of Yuman and unemployment rate among population between the ages 20 and 24 in the United States with a correlation coefficient (R) of -0.047 and weighted average of 15.8%, a difference of 53.4%.
Unemployment Among Ages 20 to 24 years Correlation Summary
| Measurement | Samoan | Yuman |
| Minimum | 3.8% | 2.3% |
| Maximum | 40.4% | 100.0% |
| Range | 36.6% | 97.7% |
| Mean | 12.9% | 34.0% |
| Median | 10.6% | 29.2% |
| Interquartile 25% (IQ1) | 9.2% | 11.8% |
| Interquartile 75% (IQ3) | 15.5% | 49.0% |
| Interquartile Range (IQR) | 6.3% | 37.2% |
| Standard Deviation (Sample) | 7.0% | 27.4% |
| Standard Deviation (Population) | 7.0% | 26.2% |
Similar Demographics by Unemployment Among Ages 20 to 24 years
Demographics Similar to Samoans by Unemployment Among Ages 20 to 24 years
In terms of unemployment among ages 20 to 24 years, the demographic groups most similar to Samoans are Potawatomi (10.3%, a difference of 0.13%), Ukrainian (10.3%, a difference of 0.17%), Immigrants from Czechoslovakia (10.3%, a difference of 0.17%), Alsatian (10.3%, a difference of 0.19%), and Immigrants from Sweden (10.3%, a difference of 0.20%).
| Demographics | Rating | Rank | Unemployment Among Ages 20 to 24 years |
| Iraqis | 56.7 /100 | #168 | Average 10.3% |
| Immigrants | Colombia | 56.3 /100 | #169 | Average 10.3% |
| Turks | 55.2 /100 | #170 | Average 10.3% |
| Immigrants | Eastern Asia | 52.7 /100 | #171 | Average 10.3% |
| Koreans | 51.9 /100 | #172 | Average 10.3% |
| Immigrants | Sweden | 50.8 /100 | #173 | Average 10.3% |
| Ukrainians | 50.0 /100 | #174 | Average 10.3% |
| Samoans | 45.4 /100 | #175 | Average 10.3% |
| Potawatomi | 42.0 /100 | #176 | Average 10.3% |
| Immigrants | Czechoslovakia | 40.8 /100 | #177 | Average 10.3% |
| Alsatians | 40.5 /100 | #178 | Average 10.3% |
| Tlingit-Haida | 39.7 /100 | #179 | Fair 10.3% |
| Immigrants | Turkey | 39.3 /100 | #180 | Fair 10.3% |
| Okinawans | 39.1 /100 | #181 | Fair 10.3% |
| Immigrants | Germany | 38.1 /100 | #182 | Fair 10.4% |
Demographics Similar to Yuman by Unemployment Among Ages 20 to 24 years
In terms of unemployment among ages 20 to 24 years, the demographic groups most similar to Yuman are Navajo (16.1%, a difference of 1.9%), Puerto Rican (16.7%, a difference of 5.1%), Immigrants from Yemen (14.9%, a difference of 6.4%), Immigrants from St. Vincent and the Grenadines (14.3%, a difference of 10.4%), and Paiute (14.3%, a difference of 10.4%).
| Demographics | Rating | Rank | Unemployment Among Ages 20 to 24 years |
| Immigrants | Guyana | 0.0 /100 | #333 | Tragic 13.9% |
| Guyanese | 0.0 /100 | #334 | Tragic 14.0% |
| Sioux | 0.0 /100 | #335 | Tragic 14.2% |
| Pima | 0.0 /100 | #336 | Tragic 14.2% |
| Paiute | 0.0 /100 | #337 | Tragic 14.3% |
| Immigrants | St. Vincent and the Grenadines | 0.0 /100 | #338 | Tragic 14.3% |
| Immigrants | Yemen | 0.0 /100 | #339 | Tragic 14.9% |
| Yuman | 0.0 /100 | #340 | Tragic 15.8% |
| Navajo | 0.0 /100 | #341 | Tragic 16.1% |
| Puerto Ricans | 0.0 /100 | #342 | Tragic 16.7% |
| Tsimshian | 0.0 /100 | #343 | Tragic 18.0% |
| Crow | 0.0 /100 | #344 | Tragic 18.7% |
| Hopi | 0.0 /100 | #345 | Tragic 19.9% |
| Yup'ik | 0.0 /100 | #346 | Tragic 20.9% |
| Inupiat | 0.0 /100 | #347 | Tragic 20.9% |