Salvadoran vs Pueblo Unemployment Among Women with Children Under 18 years
COMPARE
Salvadoran
Pueblo
Unemployment Among Women with Children Under 18 years
Unemployment Among Women with Children Under 18 years Comparison
Salvadorans
Pueblo
6.2%
UNEMPLOYMENT AMONG WOMEN WITH CHILDREN UNDER 18 YEARS
0.0/ 100
METRIC RATING
272nd/ 347
METRIC RANK
6.8%
UNEMPLOYMENT AMONG WOMEN WITH CHILDREN UNDER 18 YEARS
0.0/ 100
METRIC RATING
323rd/ 347
METRIC RANK
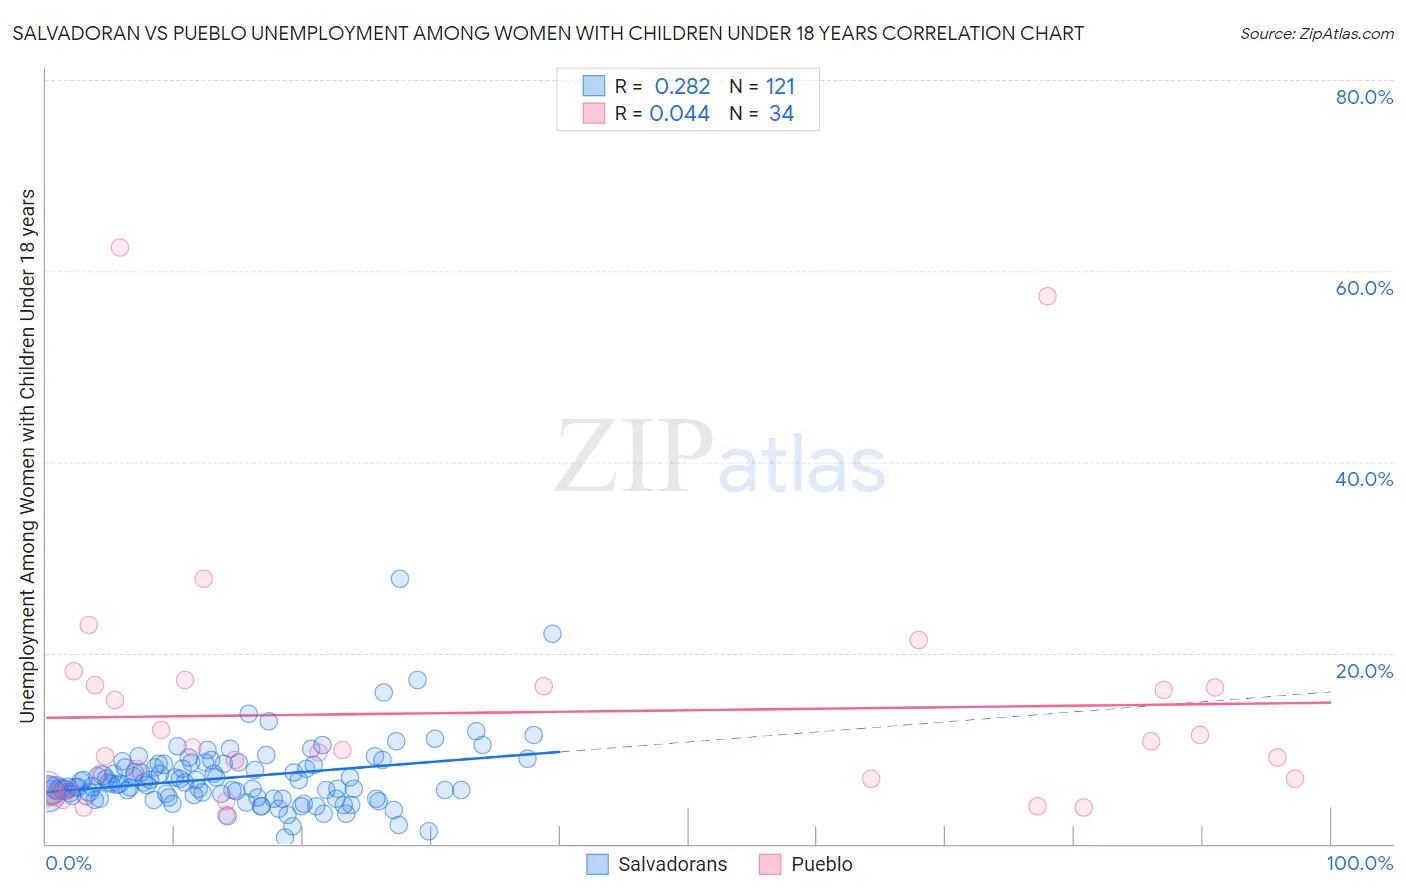
Salvadoran vs Pueblo Unemployment Among Women with Children Under 18 years Correlation Chart
The statistical analysis conducted on geographies consisting of 385,669,741 people shows a weak positive correlation between the proportion of Salvadorans and unemployment rate among women with children under the age of 18 in the United States with a correlation coefficient (R) of 0.282 and weighted average of 6.2%. Similarly, the statistical analysis conducted on geographies consisting of 118,285,687 people shows no correlation between the proportion of Pueblo and unemployment rate among women with children under the age of 18 in the United States with a correlation coefficient (R) of 0.044 and weighted average of 6.8%, a difference of 10.0%.
Unemployment Among Women with Children Under 18 years Correlation Summary
| Measurement | Salvadoran | Pueblo |
| Minimum | 0.70% | 3.0% |
| Maximum | 27.7% | 62.5% |
| Range | 27.0% | 59.5% |
| Mean | 6.9% | 13.7% |
| Median | 6.2% | 9.7% |
| Interquartile 25% (IQ1) | 5.1% | 5.8% |
| Interquartile 75% (IQ3) | 8.3% | 16.5% |
| Interquartile Range (IQR) | 3.2% | 10.7% |
| Standard Deviation (Sample) | 3.5% | 13.2% |
| Standard Deviation (Population) | 3.5% | 13.0% |
Similar Demographics by Unemployment Among Women with Children Under 18 years
Demographics Similar to Salvadorans by Unemployment Among Women with Children Under 18 years
In terms of unemployment among women with children under 18 years, the demographic groups most similar to Salvadorans are Immigrants from Western Africa (6.2%, a difference of 0.090%), Senegalese (6.2%, a difference of 0.10%), Central American (6.2%, a difference of 0.22%), Dutch West Indian (6.2%, a difference of 0.28%), and Immigrants from Ghana (6.2%, a difference of 0.39%).
| Demographics | Rating | Rank | Unemployment Among Women with Children Under 18 years |
| Immigrants | Bahamas | 0.1 /100 | #265 | Tragic 6.1% |
| Sub-Saharan Africans | 0.1 /100 | #266 | Tragic 6.2% |
| French American Indians | 0.1 /100 | #267 | Tragic 6.2% |
| Trinidadians and Tobagonians | 0.1 /100 | #268 | Tragic 6.2% |
| Cajuns | 0.1 /100 | #269 | Tragic 6.2% |
| Ghanaians | 0.1 /100 | #270 | Tragic 6.2% |
| Central Americans | 0.0 /100 | #271 | Tragic 6.2% |
| Salvadorans | 0.0 /100 | #272 | Tragic 6.2% |
| Immigrants | Western Africa | 0.0 /100 | #273 | Tragic 6.2% |
| Senegalese | 0.0 /100 | #274 | Tragic 6.2% |
| Dutch West Indians | 0.0 /100 | #275 | Tragic 6.2% |
| Immigrants | Ghana | 0.0 /100 | #276 | Tragic 6.2% |
| Mexican American Indians | 0.0 /100 | #277 | Tragic 6.2% |
| Immigrants | Barbados | 0.0 /100 | #278 | Tragic 6.2% |
| Immigrants | Portugal | 0.0 /100 | #279 | Tragic 6.3% |
Demographics Similar to Pueblo by Unemployment Among Women with Children Under 18 years
In terms of unemployment among women with children under 18 years, the demographic groups most similar to Pueblo are Houma (6.8%, a difference of 0.19%), Paiute (6.9%, a difference of 0.93%), U.S. Virgin Islander (6.7%, a difference of 2.1%), Immigrants from Dominica (7.0%, a difference of 2.1%), and Immigrants from Belize (6.7%, a difference of 2.2%).
| Demographics | Rating | Rank | Unemployment Among Women with Children Under 18 years |
| Immigrants | Ecuador | 0.0 /100 | #316 | Tragic 6.6% |
| Shoshone | 0.0 /100 | #317 | Tragic 6.6% |
| Alaska Natives | 0.0 /100 | #318 | Tragic 6.7% |
| Central American Indians | 0.0 /100 | #319 | Tragic 6.7% |
| Immigrants | Belize | 0.0 /100 | #320 | Tragic 6.7% |
| U.S. Virgin Islanders | 0.0 /100 | #321 | Tragic 6.7% |
| Houma | 0.0 /100 | #322 | Tragic 6.8% |
| Pueblo | 0.0 /100 | #323 | Tragic 6.8% |
| Paiute | 0.0 /100 | #324 | Tragic 6.9% |
| Immigrants | Dominica | 0.0 /100 | #325 | Tragic 7.0% |
| Chippewa | 0.0 /100 | #326 | Tragic 7.0% |
| Lumbee | 0.0 /100 | #327 | Tragic 7.1% |
| Natives/Alaskans | 0.0 /100 | #328 | Tragic 7.2% |
| Blacks/African Americans | 0.0 /100 | #329 | Tragic 7.3% |
| Colville | 0.0 /100 | #330 | Tragic 7.4% |