Salvadoran vs Canadian Unemployment Among Women with Children Under 18 years
COMPARE
Salvadoran
Canadian
Unemployment Among Women with Children Under 18 years
Unemployment Among Women with Children Under 18 years Comparison
Salvadorans
Canadians
6.2%
UNEMPLOYMENT AMONG WOMEN WITH CHILDREN UNDER 18 YEARS
0.0/ 100
METRIC RATING
272nd/ 347
METRIC RANK
5.3%
UNEMPLOYMENT AMONG WOMEN WITH CHILDREN UNDER 18 YEARS
87.4/ 100
METRIC RATING
117th/ 347
METRIC RANK
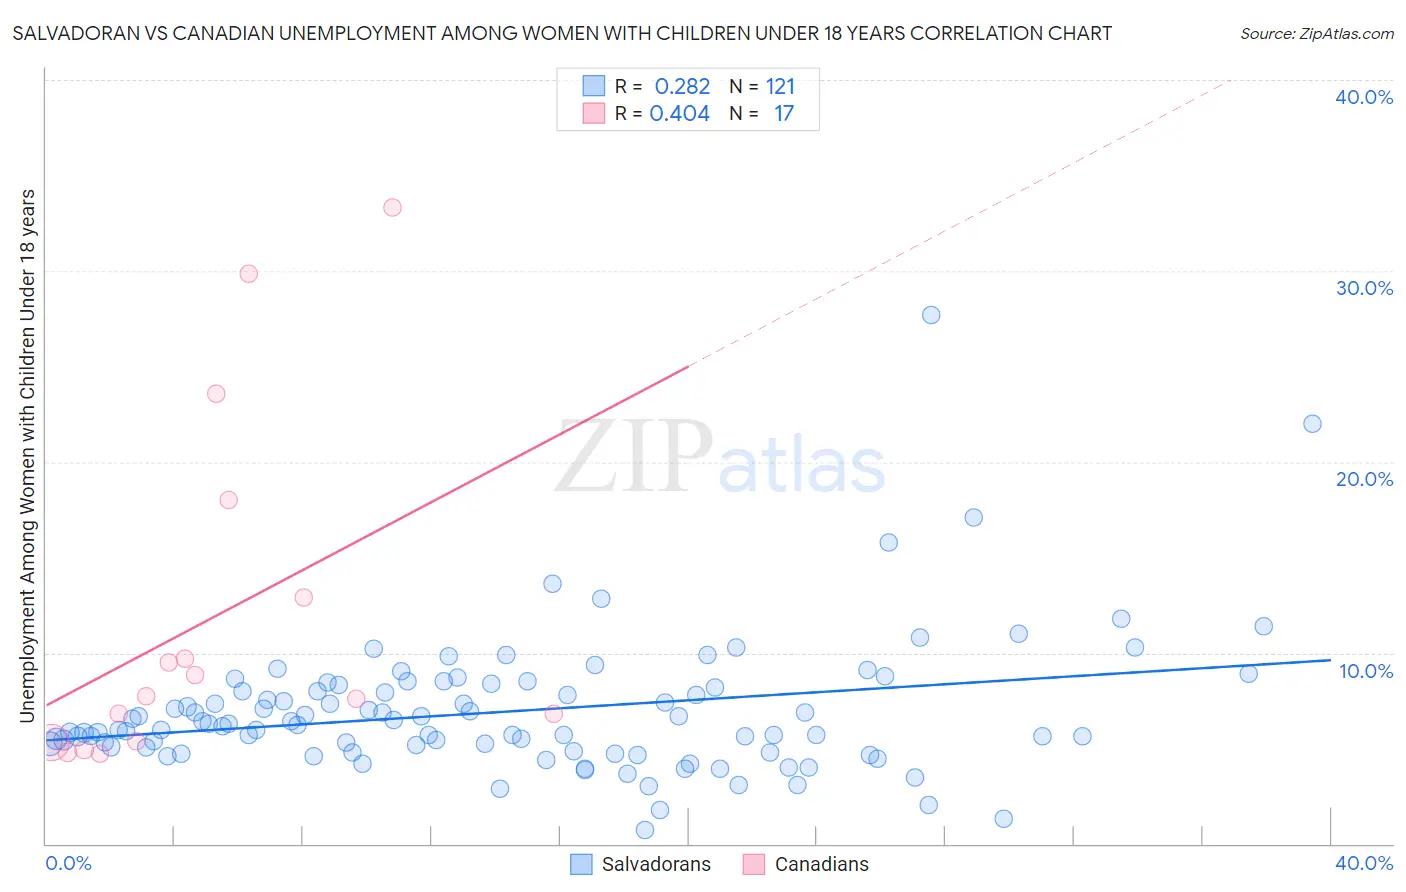
Salvadoran vs Canadian Unemployment Among Women with Children Under 18 years Correlation Chart
The statistical analysis conducted on geographies consisting of 385,669,741 people shows a weak positive correlation between the proportion of Salvadorans and unemployment rate among women with children under the age of 18 in the United States with a correlation coefficient (R) of 0.282 and weighted average of 6.2%. Similarly, the statistical analysis conducted on geographies consisting of 412,682,784 people shows a moderate positive correlation between the proportion of Canadians and unemployment rate among women with children under the age of 18 in the United States with a correlation coefficient (R) of 0.404 and weighted average of 5.3%, a difference of 18.0%.
Unemployment Among Women with Children Under 18 years Correlation Summary
| Measurement | Salvadoran | Canadian |
| Minimum | 0.70% | 4.7% |
| Maximum | 27.7% | 33.3% |
| Range | 27.0% | 28.6% |
| Mean | 6.9% | 11.7% |
| Median | 6.2% | 7.7% |
| Interquartile 25% (IQ1) | 5.1% | 5.4% |
| Interquartile 75% (IQ3) | 8.3% | 15.5% |
| Interquartile Range (IQR) | 3.2% | 10.1% |
| Standard Deviation (Sample) | 3.5% | 9.0% |
| Standard Deviation (Population) | 3.5% | 8.7% |
Similar Demographics by Unemployment Among Women with Children Under 18 years
Demographics Similar to Salvadorans by Unemployment Among Women with Children Under 18 years
In terms of unemployment among women with children under 18 years, the demographic groups most similar to Salvadorans are Immigrants from Western Africa (6.2%, a difference of 0.090%), Senegalese (6.2%, a difference of 0.10%), Central American (6.2%, a difference of 0.22%), Dutch West Indian (6.2%, a difference of 0.28%), and Immigrants from Ghana (6.2%, a difference of 0.39%).
| Demographics | Rating | Rank | Unemployment Among Women with Children Under 18 years |
| Immigrants | Bahamas | 0.1 /100 | #265 | Tragic 6.1% |
| Sub-Saharan Africans | 0.1 /100 | #266 | Tragic 6.2% |
| French American Indians | 0.1 /100 | #267 | Tragic 6.2% |
| Trinidadians and Tobagonians | 0.1 /100 | #268 | Tragic 6.2% |
| Cajuns | 0.1 /100 | #269 | Tragic 6.2% |
| Ghanaians | 0.1 /100 | #270 | Tragic 6.2% |
| Central Americans | 0.0 /100 | #271 | Tragic 6.2% |
| Salvadorans | 0.0 /100 | #272 | Tragic 6.2% |
| Immigrants | Western Africa | 0.0 /100 | #273 | Tragic 6.2% |
| Senegalese | 0.0 /100 | #274 | Tragic 6.2% |
| Dutch West Indians | 0.0 /100 | #275 | Tragic 6.2% |
| Immigrants | Ghana | 0.0 /100 | #276 | Tragic 6.2% |
| Mexican American Indians | 0.0 /100 | #277 | Tragic 6.2% |
| Immigrants | Barbados | 0.0 /100 | #278 | Tragic 6.2% |
| Immigrants | Portugal | 0.0 /100 | #279 | Tragic 6.3% |
Demographics Similar to Canadians by Unemployment Among Women with Children Under 18 years
In terms of unemployment among women with children under 18 years, the demographic groups most similar to Canadians are Macedonian (5.3%, a difference of 0.060%), Immigrants from Europe (5.3%, a difference of 0.10%), Hungarian (5.3%, a difference of 0.13%), Basque (5.3%, a difference of 0.13%), and Kenyan (5.3%, a difference of 0.14%).
| Demographics | Rating | Rank | Unemployment Among Women with Children Under 18 years |
| Immigrants | Czechoslovakia | 88.9 /100 | #110 | Excellent 5.2% |
| French Canadians | 88.9 /100 | #111 | Excellent 5.2% |
| Immigrants | Eastern Europe | 88.5 /100 | #112 | Excellent 5.2% |
| French | 88.4 /100 | #113 | Excellent 5.2% |
| Kenyans | 88.2 /100 | #114 | Excellent 5.3% |
| Hungarians | 88.1 /100 | #115 | Excellent 5.3% |
| Macedonians | 87.7 /100 | #116 | Excellent 5.3% |
| Canadians | 87.4 /100 | #117 | Excellent 5.3% |
| Immigrants | Europe | 86.7 /100 | #118 | Excellent 5.3% |
| Basques | 86.5 /100 | #119 | Excellent 5.3% |
| Egyptians | 86.4 /100 | #120 | Excellent 5.3% |
| Immigrants | Romania | 85.8 /100 | #121 | Excellent 5.3% |
| Scotch-Irish | 85.7 /100 | #122 | Excellent 5.3% |
| Sudanese | 84.3 /100 | #123 | Excellent 5.3% |
| Native Hawaiians | 84.0 /100 | #124 | Excellent 5.3% |