Yuman vs Pueblo Unemployment Among Women with Children Under 18 years
COMPARE
Yuman
Pueblo
Unemployment Among Women with Children Under 18 years
Unemployment Among Women with Children Under 18 years Comparison
Yuman
Pueblo
9.8%
UNEMPLOYMENT AMONG WOMEN WITH CHILDREN UNDER 18 YEARS
0.0/ 100
METRIC RATING
345th/ 347
METRIC RANK
6.8%
UNEMPLOYMENT AMONG WOMEN WITH CHILDREN UNDER 18 YEARS
0.0/ 100
METRIC RATING
323rd/ 347
METRIC RANK
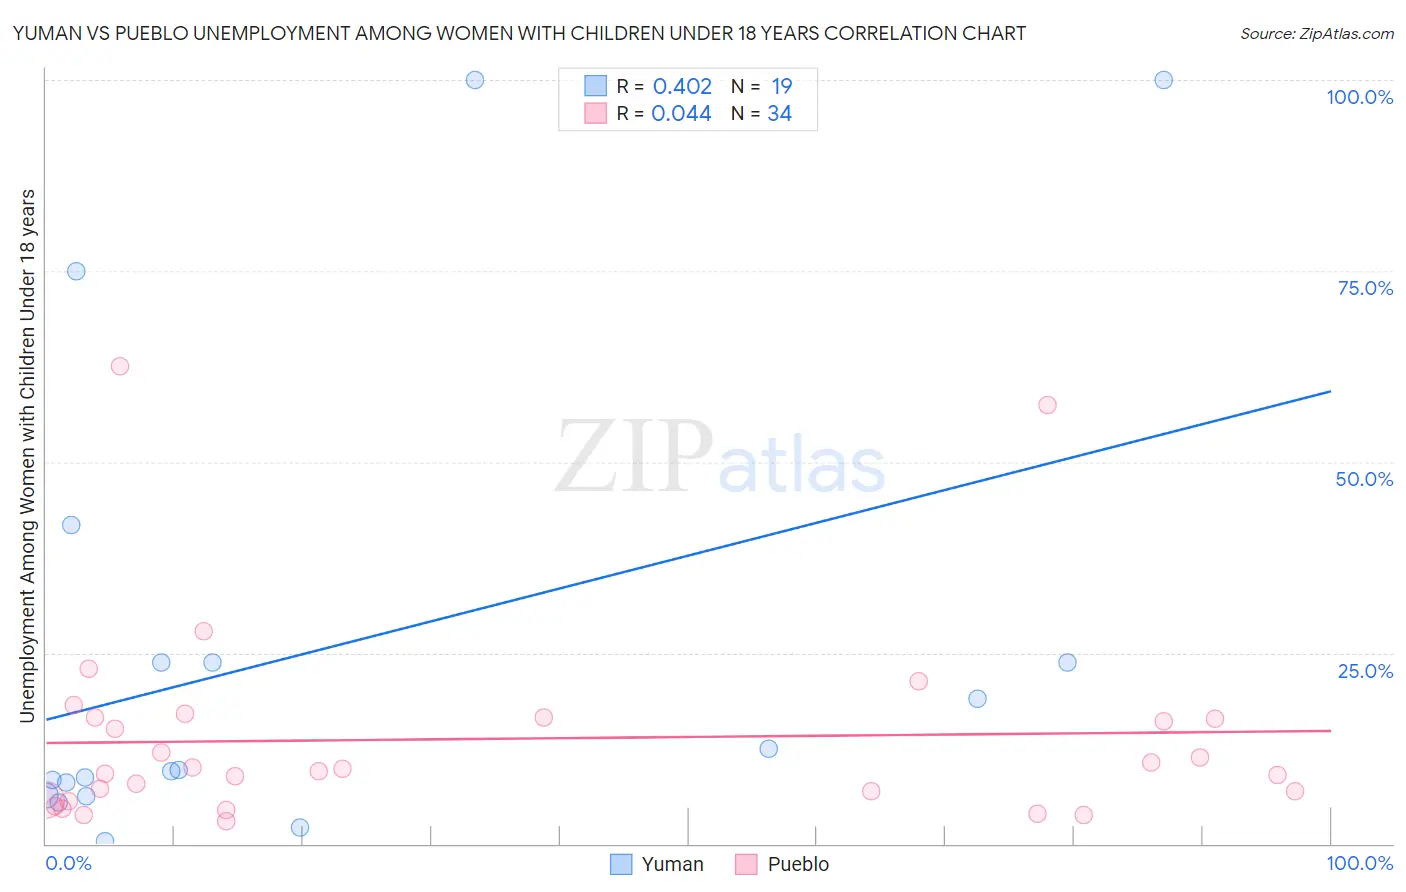
Yuman vs Pueblo Unemployment Among Women with Children Under 18 years Correlation Chart
The statistical analysis conducted on geographies consisting of 40,332,317 people shows a moderate positive correlation between the proportion of Yuman and unemployment rate among women with children under the age of 18 in the United States with a correlation coefficient (R) of 0.402 and weighted average of 9.8%. Similarly, the statistical analysis conducted on geographies consisting of 118,285,687 people shows no correlation between the proportion of Pueblo and unemployment rate among women with children under the age of 18 in the United States with a correlation coefficient (R) of 0.044 and weighted average of 6.8%, a difference of 43.1%.
Unemployment Among Women with Children Under 18 years Correlation Summary
| Measurement | Yuman | Pueblo |
| Minimum | 0.30% | 3.0% |
| Maximum | 100.0% | 62.5% |
| Range | 99.7% | 59.5% |
| Mean | 25.5% | 13.7% |
| Median | 9.6% | 9.7% |
| Interquartile 25% (IQ1) | 6.3% | 5.8% |
| Interquartile 75% (IQ3) | 23.8% | 16.5% |
| Interquartile Range (IQR) | 17.5% | 10.7% |
| Standard Deviation (Sample) | 31.4% | 13.2% |
| Standard Deviation (Population) | 30.6% | 13.0% |
Similar Demographics by Unemployment Among Women with Children Under 18 years
Demographics Similar to Yuman by Unemployment Among Women with Children Under 18 years
In terms of unemployment among women with children under 18 years, the demographic groups most similar to Yuman are Inupiat (9.6%, a difference of 1.9%), Arapaho (9.2%, a difference of 6.2%), Puerto Rican (9.0%, a difference of 8.4%), Tohono O'odham (8.9%, a difference of 10.2%), and Yup'ik (11.0%, a difference of 12.9%).
| Demographics | Rating | Rank | Unemployment Among Women with Children Under 18 years |
| Immigrants | Dominican Republic | 0.0 /100 | #333 | Tragic 7.5% |
| Cheyenne | 0.0 /100 | #334 | Tragic 7.8% |
| Apache | 0.0 /100 | #335 | Tragic 7.9% |
| Sioux | 0.0 /100 | #336 | Tragic 7.9% |
| Yakama | 0.0 /100 | #337 | Tragic 8.1% |
| Immigrants | Yemen | 0.0 /100 | #338 | Tragic 8.2% |
| Navajo | 0.0 /100 | #339 | Tragic 8.2% |
| Crow | 0.0 /100 | #340 | Tragic 8.2% |
| Tohono O'odham | 0.0 /100 | #341 | Tragic 8.9% |
| Puerto Ricans | 0.0 /100 | #342 | Tragic 9.0% |
| Arapaho | 0.0 /100 | #343 | Tragic 9.2% |
| Inupiat | 0.0 /100 | #344 | Tragic 9.6% |
| Yuman | 0.0 /100 | #345 | Tragic 9.8% |
| Yup'ik | 0.0 /100 | #346 | Tragic 11.0% |
| Pima | 0.0 /100 | #347 | Tragic 11.7% |
Demographics Similar to Pueblo by Unemployment Among Women with Children Under 18 years
In terms of unemployment among women with children under 18 years, the demographic groups most similar to Pueblo are Houma (6.8%, a difference of 0.19%), Paiute (6.9%, a difference of 0.93%), U.S. Virgin Islander (6.7%, a difference of 2.1%), Immigrants from Dominica (7.0%, a difference of 2.1%), and Immigrants from Belize (6.7%, a difference of 2.2%).
| Demographics | Rating | Rank | Unemployment Among Women with Children Under 18 years |
| Immigrants | Ecuador | 0.0 /100 | #316 | Tragic 6.6% |
| Shoshone | 0.0 /100 | #317 | Tragic 6.6% |
| Alaska Natives | 0.0 /100 | #318 | Tragic 6.7% |
| Central American Indians | 0.0 /100 | #319 | Tragic 6.7% |
| Immigrants | Belize | 0.0 /100 | #320 | Tragic 6.7% |
| U.S. Virgin Islanders | 0.0 /100 | #321 | Tragic 6.7% |
| Houma | 0.0 /100 | #322 | Tragic 6.8% |
| Pueblo | 0.0 /100 | #323 | Tragic 6.8% |
| Paiute | 0.0 /100 | #324 | Tragic 6.9% |
| Immigrants | Dominica | 0.0 /100 | #325 | Tragic 7.0% |
| Chippewa | 0.0 /100 | #326 | Tragic 7.0% |
| Lumbee | 0.0 /100 | #327 | Tragic 7.1% |
| Natives/Alaskans | 0.0 /100 | #328 | Tragic 7.2% |
| Blacks/African Americans | 0.0 /100 | #329 | Tragic 7.3% |
| Colville | 0.0 /100 | #330 | Tragic 7.4% |