Salvadoran vs Immigrants from El Salvador Child Poverty Under the Age of 5
COMPARE
Salvadoran
Immigrants from El Salvador
Child Poverty Under the Age of 5
Child Poverty Under the Age of 5 Comparison
Salvadorans
Immigrants from El Salvador
19.5%
CHILD POVERTY UNDER THE AGE OF 5
0.6/ 100
METRIC RATING
238th/ 347
METRIC RANK
20.0%
CHILD POVERTY UNDER THE AGE OF 5
0.2/ 100
METRIC RATING
259th/ 347
METRIC RANK
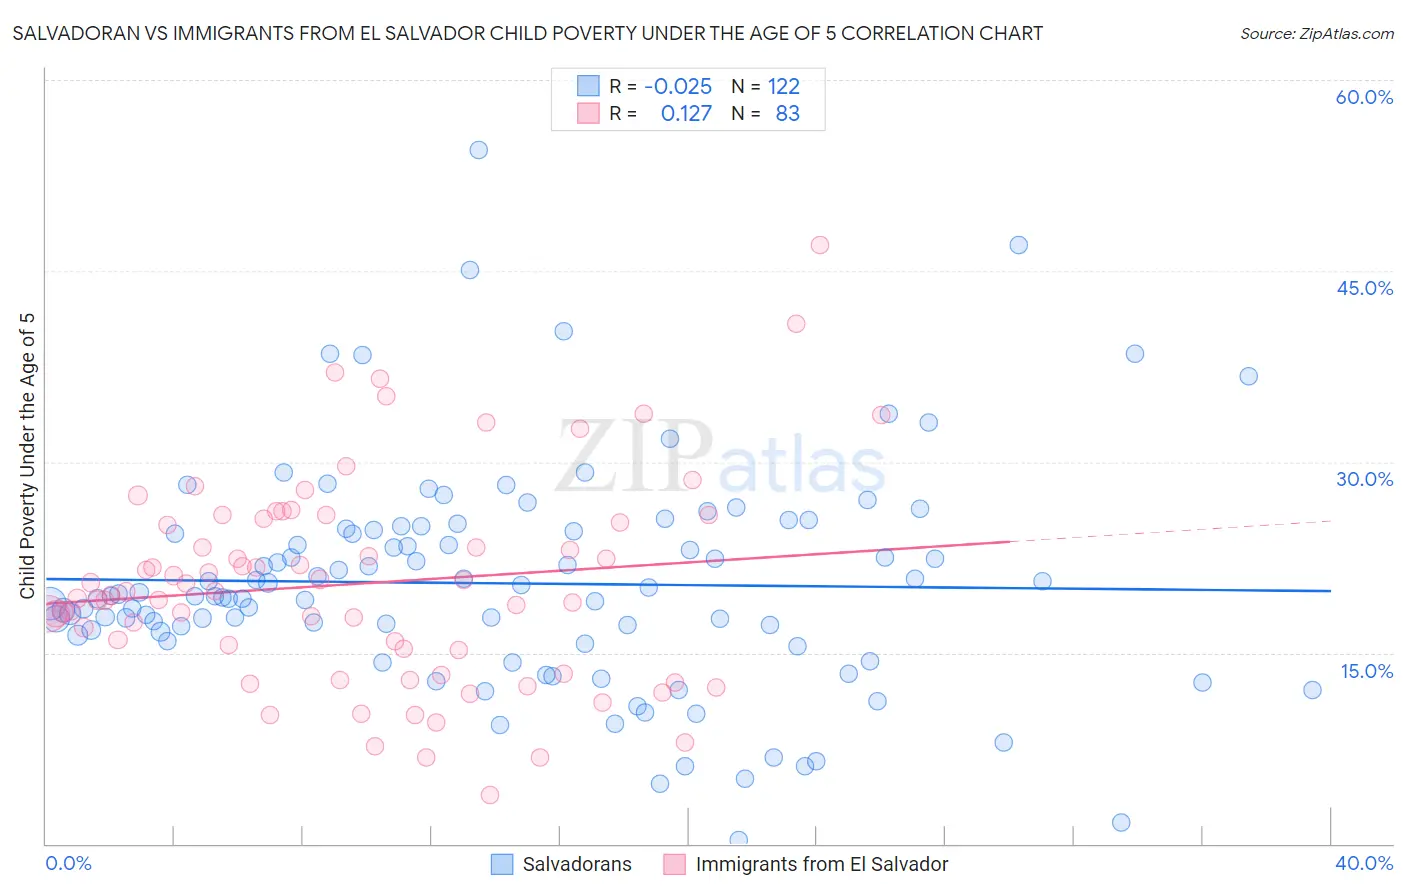
Salvadoran vs Immigrants from El Salvador Child Poverty Under the Age of 5 Correlation Chart
The statistical analysis conducted on geographies consisting of 386,669,991 people shows no correlation between the proportion of Salvadorans and poverty level among children under the age of 5 in the United States with a correlation coefficient (R) of -0.025 and weighted average of 19.5%. Similarly, the statistical analysis conducted on geographies consisting of 348,349,886 people shows a poor positive correlation between the proportion of Immigrants from El Salvador and poverty level among children under the age of 5 in the United States with a correlation coefficient (R) of 0.127 and weighted average of 20.0%, a difference of 2.5%.
Child Poverty Under the Age of 5 Correlation Summary
| Measurement | Salvadoran | Immigrants from El Salvador |
| Minimum | 0.31% | 3.8% |
| Maximum | 54.5% | 47.0% |
| Range | 54.2% | 43.2% |
| Mean | 20.5% | 20.4% |
| Median | 19.5% | 19.8% |
| Interquartile 25% (IQ1) | 16.4% | 15.2% |
| Interquartile 75% (IQ3) | 24.6% | 25.5% |
| Interquartile Range (IQR) | 8.2% | 10.3% |
| Standard Deviation (Sample) | 8.7% | 8.2% |
| Standard Deviation (Population) | 8.7% | 8.1% |
Similar Demographics by Child Poverty Under the Age of 5
Demographics Similar to Salvadorans by Child Poverty Under the Age of 5
In terms of child poverty under the age of 5, the demographic groups most similar to Salvadorans are Immigrants from Cabo Verde (19.5%, a difference of 0.010%), Vietnamese (19.5%, a difference of 0.020%), Immigrants from Ecuador (19.6%, a difference of 0.40%), Alaska Native (19.6%, a difference of 0.46%), and Immigrants from Laos (19.4%, a difference of 0.57%).
| Demographics | Rating | Rank | Child Poverty Under the Age of 5 |
| Bermudans | 1.2 /100 | #231 | Tragic 19.2% |
| Trinidadians and Tobagonians | 0.9 /100 | #232 | Tragic 19.3% |
| Sudanese | 0.9 /100 | #233 | Tragic 19.3% |
| Immigrants | Micronesia | 0.9 /100 | #234 | Tragic 19.4% |
| Immigrants | Laos | 0.8 /100 | #235 | Tragic 19.4% |
| Immigrants | Trinidad and Tobago | 0.8 /100 | #236 | Tragic 19.4% |
| Immigrants | Cabo Verde | 0.6 /100 | #237 | Tragic 19.5% |
| Salvadorans | 0.6 /100 | #238 | Tragic 19.5% |
| Vietnamese | 0.6 /100 | #239 | Tragic 19.5% |
| Immigrants | Ecuador | 0.5 /100 | #240 | Tragic 19.6% |
| Alaska Natives | 0.5 /100 | #241 | Tragic 19.6% |
| Immigrants | Guyana | 0.5 /100 | #242 | Tragic 19.6% |
| Osage | 0.5 /100 | #243 | Tragic 19.6% |
| Immigrants | Ghana | 0.5 /100 | #244 | Tragic 19.6% |
| Immigrants | Western Africa | 0.4 /100 | #245 | Tragic 19.7% |
Demographics Similar to Immigrants from El Salvador by Child Poverty Under the Age of 5
In terms of child poverty under the age of 5, the demographic groups most similar to Immigrants from El Salvador are Immigrants from St. Vincent and the Grenadines (20.0%, a difference of 0.030%), Shoshone (20.0%, a difference of 0.16%), Immigrants from Barbados (20.0%, a difference of 0.17%), Immigrants from Cuba (19.9%, a difference of 0.39%), and Spanish American (20.1%, a difference of 0.40%).
| Demographics | Rating | Rank | Child Poverty Under the Age of 5 |
| Immigrants | Nicaragua | 0.3 /100 | #252 | Tragic 19.8% |
| Mexican American Indians | 0.3 /100 | #253 | Tragic 19.9% |
| Fijians | 0.3 /100 | #254 | Tragic 19.9% |
| Immigrants | Cuba | 0.2 /100 | #255 | Tragic 19.9% |
| Immigrants | Barbados | 0.2 /100 | #256 | Tragic 20.0% |
| Shoshone | 0.2 /100 | #257 | Tragic 20.0% |
| Immigrants | St. Vincent and the Grenadines | 0.2 /100 | #258 | Tragic 20.0% |
| Immigrants | El Salvador | 0.2 /100 | #259 | Tragic 20.0% |
| Spanish Americans | 0.2 /100 | #260 | Tragic 20.1% |
| Immigrants | Bangladesh | 0.2 /100 | #261 | Tragic 20.1% |
| Liberians | 0.1 /100 | #262 | Tragic 20.2% |
| Barbadians | 0.1 /100 | #263 | Tragic 20.2% |
| Immigrants | Liberia | 0.1 /100 | #264 | Tragic 20.2% |
| Spanish American Indians | 0.1 /100 | #265 | Tragic 20.2% |
| Aleuts | 0.1 /100 | #266 | Tragic 20.3% |