Puget Sound Salish vs Cajun Unemployment Among Ages 45 to 54 years
COMPARE
Puget Sound Salish
Cajun
Unemployment Among Ages 45 to 54 years
Unemployment Among Ages 45 to 54 years Comparison
Puget Sound Salish
Cajuns
4.5%
UNEMPLOYMENT AMONG AGES 45 TO 54 YEARS
49.1/ 100
METRIC RATING
176th/ 347
METRIC RANK
5.0%
UNEMPLOYMENT AMONG AGES 45 TO 54 YEARS
0.0/ 100
METRIC RATING
271st/ 347
METRIC RANK
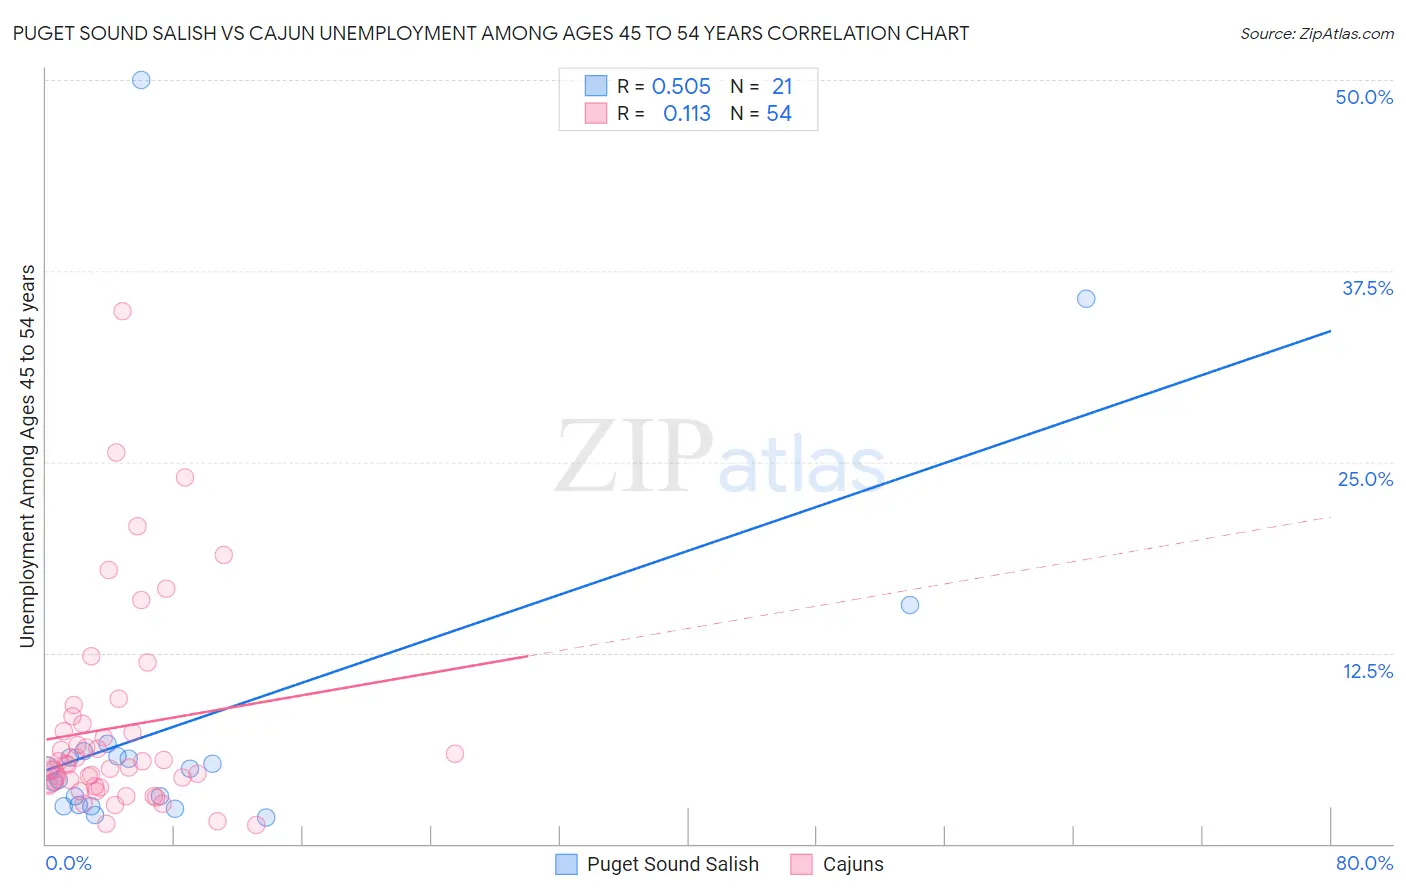
Puget Sound Salish vs Cajun Unemployment Among Ages 45 to 54 years Correlation Chart
The statistical analysis conducted on geographies consisting of 45,771,466 people shows a substantial positive correlation between the proportion of Puget Sound Salish and unemployment rate among population between the ages 45 and 54 in the United States with a correlation coefficient (R) of 0.505 and weighted average of 4.5%. Similarly, the statistical analysis conducted on geographies consisting of 146,835,956 people shows a poor positive correlation between the proportion of Cajuns and unemployment rate among population between the ages 45 and 54 in the United States with a correlation coefficient (R) of 0.113 and weighted average of 5.0%, a difference of 9.8%.
Unemployment Among Ages 45 to 54 years Correlation Summary
| Measurement | Puget Sound Salish | Cajun |
| Minimum | 1.7% | 1.2% |
| Maximum | 50.0% | 34.9% |
| Range | 48.3% | 33.7% |
| Mean | 8.3% | 7.6% |
| Median | 4.9% | 5.2% |
| Interquartile 25% (IQ1) | 2.5% | 3.9% |
| Interquartile 75% (IQ3) | 5.9% | 7.8% |
| Interquartile Range (IQR) | 3.4% | 4.0% |
| Standard Deviation (Sample) | 12.1% | 6.8% |
| Standard Deviation (Population) | 11.8% | 6.7% |
Similar Demographics by Unemployment Among Ages 45 to 54 years
Demographics Similar to Puget Sound Salish by Unemployment Among Ages 45 to 54 years
In terms of unemployment among ages 45 to 54 years, the demographic groups most similar to Puget Sound Salish are Immigrants from Northern Africa (4.5%, a difference of 0.0%), Immigrants from France (4.5%, a difference of 0.020%), Immigrants from Australia (4.5%, a difference of 0.030%), Immigrants from Hungary (4.5%, a difference of 0.040%), and Immigrants from Russia (4.5%, a difference of 0.040%).
| Demographics | Rating | Rank | Unemployment Among Ages 45 to 54 years |
| Immigrants | Egypt | 54.7 /100 | #169 | Average 4.5% |
| Spaniards | 54.3 /100 | #170 | Average 4.5% |
| Egyptians | 53.6 /100 | #171 | Average 4.5% |
| Colombians | 53.3 /100 | #172 | Average 4.5% |
| Immigrants | Colombia | 52.0 /100 | #173 | Average 4.5% |
| Immigrants | Hungary | 50.0 /100 | #174 | Average 4.5% |
| Immigrants | France | 49.4 /100 | #175 | Average 4.5% |
| Puget Sound Salish | 49.1 /100 | #176 | Average 4.5% |
| Immigrants | Northern Africa | 49.0 /100 | #177 | Average 4.5% |
| Immigrants | Australia | 48.5 /100 | #178 | Average 4.5% |
| Immigrants | Russia | 48.2 /100 | #179 | Average 4.5% |
| Malaysians | 47.5 /100 | #180 | Average 4.5% |
| Immigrants | Poland | 47.0 /100 | #181 | Average 4.5% |
| Immigrants | China | 46.7 /100 | #182 | Average 4.5% |
| Sierra Leoneans | 46.7 /100 | #183 | Average 4.5% |
Demographics Similar to Cajuns by Unemployment Among Ages 45 to 54 years
In terms of unemployment among ages 45 to 54 years, the demographic groups most similar to Cajuns are Immigrants from Ghana (5.0%, a difference of 0.070%), Immigrants from Central America (5.0%, a difference of 0.17%), Somali (5.0%, a difference of 0.22%), Immigrants from Latin America (5.0%, a difference of 0.33%), and U.S. Virgin Islander (5.0%, a difference of 0.39%).
| Demographics | Rating | Rank | Unemployment Among Ages 45 to 54 years |
| Immigrants | Guatemala | 0.1 /100 | #264 | Tragic 4.9% |
| Immigrants | Somalia | 0.1 /100 | #265 | Tragic 4.9% |
| Ghanaians | 0.0 /100 | #266 | Tragic 4.9% |
| Bahamians | 0.0 /100 | #267 | Tragic 4.9% |
| Immigrants | Uzbekistan | 0.0 /100 | #268 | Tragic 4.9% |
| Somalis | 0.0 /100 | #269 | Tragic 5.0% |
| Immigrants | Ghana | 0.0 /100 | #270 | Tragic 5.0% |
| Cajuns | 0.0 /100 | #271 | Tragic 5.0% |
| Immigrants | Central America | 0.0 /100 | #272 | Tragic 5.0% |
| Immigrants | Latin America | 0.0 /100 | #273 | Tragic 5.0% |
| U.S. Virgin Islanders | 0.0 /100 | #274 | Tragic 5.0% |
| Bermudans | 0.0 /100 | #275 | Tragic 5.0% |
| French American Indians | 0.0 /100 | #276 | Tragic 5.0% |
| Immigrants | Mexico | 0.0 /100 | #277 | Tragic 5.0% |
| Dutch West Indians | 0.0 /100 | #278 | Tragic 5.0% |