Puget Sound Salish vs Cajun 4th Grade
COMPARE
Puget Sound Salish
Cajun
4th Grade
4th Grade Comparison
Puget Sound Salish
Cajuns
97.9%
4TH GRADE
97.7/ 100
METRIC RATING
103rd/ 347
METRIC RANK
98.0%
4TH GRADE
99.7/ 100
METRIC RATING
64th/ 347
METRIC RANK
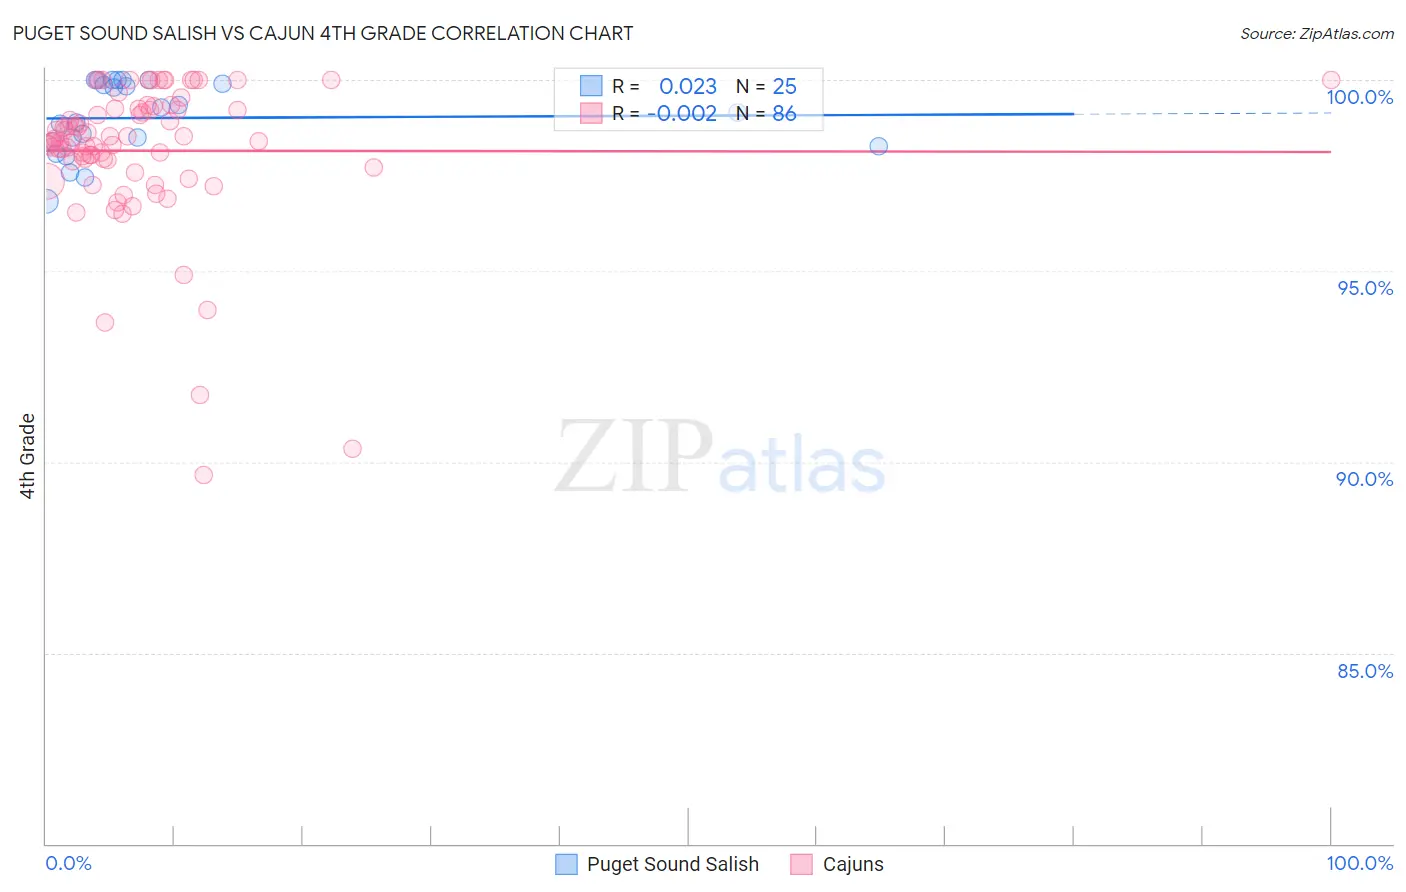
Puget Sound Salish vs Cajun 4th Grade Correlation Chart
The statistical analysis conducted on geographies consisting of 46,155,746 people shows no correlation between the proportion of Puget Sound Salish and percentage of population with at least 4th grade education in the United States with a correlation coefficient (R) of 0.023 and weighted average of 97.9%. Similarly, the statistical analysis conducted on geographies consisting of 149,712,957 people shows no correlation between the proportion of Cajuns and percentage of population with at least 4th grade education in the United States with a correlation coefficient (R) of -0.002 and weighted average of 98.0%, a difference of 0.18%.
4th Grade Correlation Summary
| Measurement | Puget Sound Salish | Cajun |
| Minimum | 96.8% | 89.7% |
| Maximum | 100.0% | 100.0% |
| Range | 3.2% | 10.3% |
| Mean | 99.0% | 98.1% |
| Median | 99.2% | 98.4% |
| Interquartile 25% (IQ1) | 98.3% | 97.9% |
| Interquartile 75% (IQ3) | 100.0% | 99.2% |
| Interquartile Range (IQR) | 1.6% | 1.4% |
| Standard Deviation (Sample) | 0.95% | 1.9% |
| Standard Deviation (Population) | 0.94% | 1.9% |
Similar Demographics by 4th Grade
Demographics Similar to Puget Sound Salish by 4th Grade
In terms of 4th grade, the demographic groups most similar to Puget Sound Salish are Choctaw (97.9%, a difference of 0.010%), Nonimmigrants (97.9%, a difference of 0.010%), German Russian (97.9%, a difference of 0.010%), Immigrants from Czechoslovakia (97.9%, a difference of 0.010%), and Bhutanese (97.9%, a difference of 0.010%).
| Demographics | Rating | Rank | 4th Grade |
| Romanians | 98.4 /100 | #96 | Exceptional 97.9% |
| Cheyenne | 98.4 /100 | #97 | Exceptional 97.9% |
| South Africans | 98.2 /100 | #98 | Exceptional 97.9% |
| Turks | 98.2 /100 | #99 | Exceptional 97.9% |
| Yugoslavians | 98.1 /100 | #100 | Exceptional 97.9% |
| Cree | 98.1 /100 | #101 | Exceptional 97.9% |
| Choctaw | 97.9 /100 | #102 | Exceptional 97.9% |
| Puget Sound Salish | 97.7 /100 | #103 | Exceptional 97.9% |
| Immigrants | Nonimmigrants | 97.5 /100 | #104 | Exceptional 97.9% |
| German Russians | 97.5 /100 | #105 | Exceptional 97.9% |
| Immigrants | Czechoslovakia | 97.5 /100 | #106 | Exceptional 97.9% |
| Bhutanese | 97.4 /100 | #107 | Exceptional 97.9% |
| Immigrants | Singapore | 97.3 /100 | #108 | Exceptional 97.9% |
| Immigrants | Latvia | 96.8 /100 | #109 | Exceptional 97.8% |
| Thais | 96.7 /100 | #110 | Exceptional 97.8% |
Demographics Similar to Cajuns by 4th Grade
In terms of 4th grade, the demographic groups most similar to Cajuns are Immigrants from Northern Europe (98.0%, a difference of 0.0%), Serbian (98.1%, a difference of 0.010%), Russian (98.0%, a difference of 0.010%), Canadian (98.0%, a difference of 0.010%), and New Zealander (98.0%, a difference of 0.010%).
| Demographics | Rating | Rank | 4th Grade |
| Austrians | 99.8 /100 | #57 | Exceptional 98.1% |
| Creek | 99.8 /100 | #58 | Exceptional 98.1% |
| Americans | 99.8 /100 | #59 | Exceptional 98.1% |
| Immigrants | Canada | 99.7 /100 | #60 | Exceptional 98.1% |
| Immigrants | North America | 99.7 /100 | #61 | Exceptional 98.1% |
| Serbians | 99.7 /100 | #62 | Exceptional 98.1% |
| Russians | 99.7 /100 | #63 | Exceptional 98.0% |
| Cajuns | 99.7 /100 | #64 | Exceptional 98.0% |
| Immigrants | Northern Europe | 99.6 /100 | #65 | Exceptional 98.0% |
| Canadians | 99.6 /100 | #66 | Exceptional 98.0% |
| New Zealanders | 99.6 /100 | #67 | Exceptional 98.0% |
| Kiowa | 99.6 /100 | #68 | Exceptional 98.0% |
| Pueblo | 99.6 /100 | #69 | Exceptional 98.0% |
| Immigrants | Austria | 99.6 /100 | #70 | Exceptional 98.0% |
| Lumbee | 99.6 /100 | #71 | Exceptional 98.0% |