Puget Sound Salish vs Estonian Unemployment Among Ages 45 to 54 years
COMPARE
Puget Sound Salish
Estonian
Unemployment Among Ages 45 to 54 years
Unemployment Among Ages 45 to 54 years Comparison
Puget Sound Salish
Estonians
4.5%
UNEMPLOYMENT AMONG AGES 45 TO 54 YEARS
49.1/ 100
METRIC RATING
176th/ 347
METRIC RANK
4.6%
UNEMPLOYMENT AMONG AGES 45 TO 54 YEARS
31.2/ 100
METRIC RATING
196th/ 347
METRIC RANK
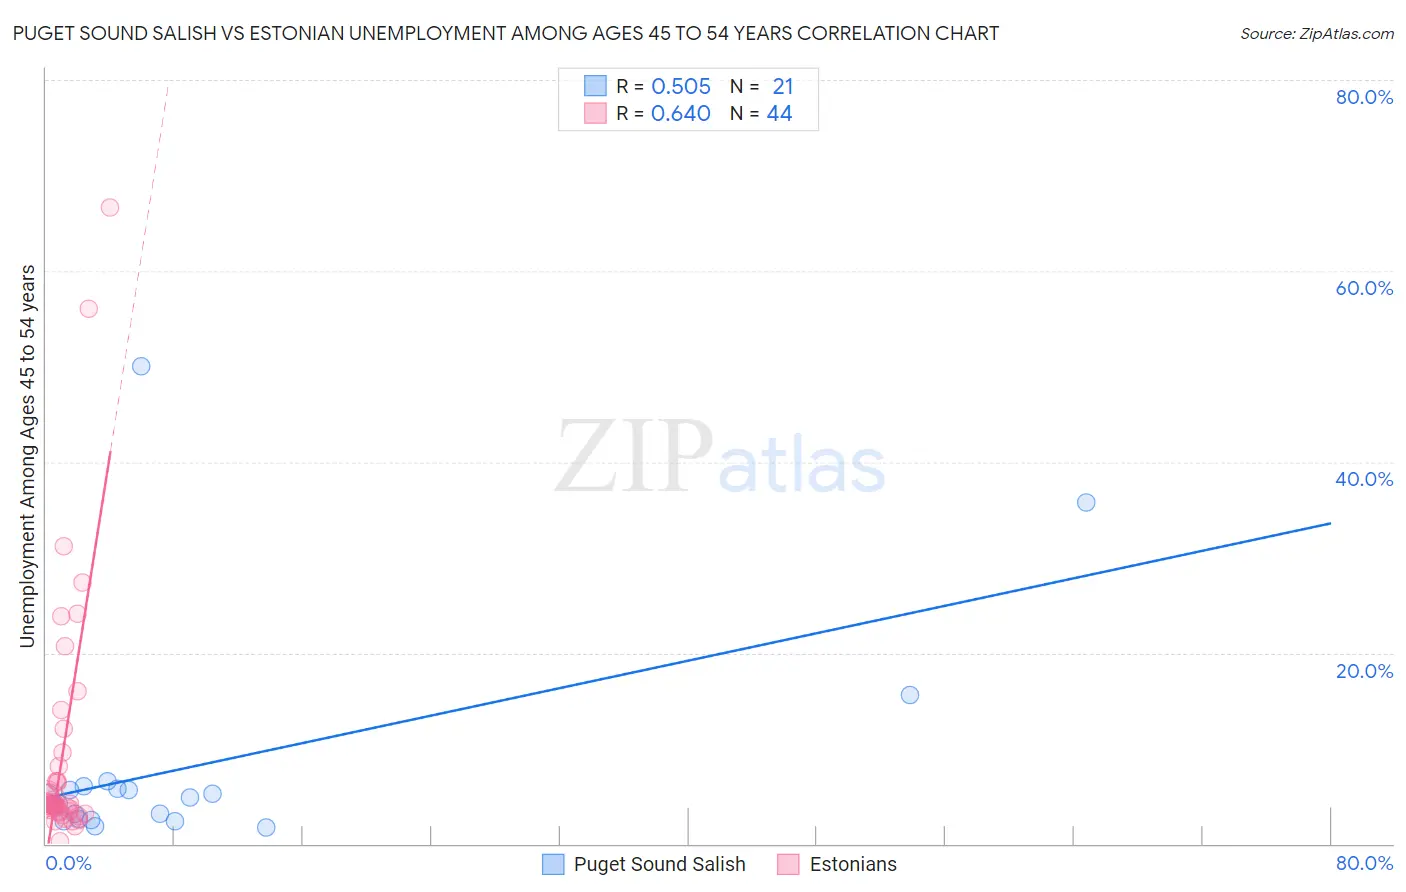
Puget Sound Salish vs Estonian Unemployment Among Ages 45 to 54 years Correlation Chart
The statistical analysis conducted on geographies consisting of 45,771,466 people shows a substantial positive correlation between the proportion of Puget Sound Salish and unemployment rate among population between the ages 45 and 54 in the United States with a correlation coefficient (R) of 0.505 and weighted average of 4.5%. Similarly, the statistical analysis conducted on geographies consisting of 122,283,099 people shows a significant positive correlation between the proportion of Estonians and unemployment rate among population between the ages 45 and 54 in the United States with a correlation coefficient (R) of 0.640 and weighted average of 4.6%, a difference of 0.88%.
Unemployment Among Ages 45 to 54 years Correlation Summary
| Measurement | Puget Sound Salish | Estonian |
| Minimum | 1.7% | 0.30% |
| Maximum | 50.0% | 66.7% |
| Range | 48.3% | 66.4% |
| Mean | 8.3% | 9.8% |
| Median | 4.9% | 4.2% |
| Interquartile 25% (IQ1) | 2.5% | 3.4% |
| Interquartile 75% (IQ3) | 5.9% | 8.8% |
| Interquartile Range (IQR) | 3.4% | 5.4% |
| Standard Deviation (Sample) | 12.1% | 13.6% |
| Standard Deviation (Population) | 11.8% | 13.4% |
Demographics Similar to Puget Sound Salish and Estonians by Unemployment Among Ages 45 to 54 years
In terms of unemployment among ages 45 to 54 years, the demographic groups most similar to Puget Sound Salish are Immigrants from Northern Africa (4.5%, a difference of 0.0%), Immigrants from Australia (4.5%, a difference of 0.030%), Immigrants from Russia (4.5%, a difference of 0.040%), Malaysian (4.5%, a difference of 0.080%), and Immigrants from Poland (4.5%, a difference of 0.10%). Similarly, the demographic groups most similar to Estonians are Peruvian (4.6%, a difference of 0.020%), South American (4.6%, a difference of 0.090%), Immigrants from Lithuania (4.6%, a difference of 0.11%), Immigrants from Thailand (4.6%, a difference of 0.15%), and Immigrants from Uruguay (4.6%, a difference of 0.17%).
| Demographics | Rating | Rank | Unemployment Among Ages 45 to 54 years |
| Puget Sound Salish | 49.1 /100 | #176 | Average 4.5% |
| Immigrants | Northern Africa | 49.0 /100 | #177 | Average 4.5% |
| Immigrants | Australia | 48.5 /100 | #178 | Average 4.5% |
| Immigrants | Russia | 48.2 /100 | #179 | Average 4.5% |
| Malaysians | 47.5 /100 | #180 | Average 4.5% |
| Immigrants | Poland | 47.0 /100 | #181 | Average 4.5% |
| Immigrants | China | 46.7 /100 | #182 | Average 4.5% |
| Sierra Leoneans | 46.7 /100 | #183 | Average 4.5% |
| Immigrants | Hong Kong | 45.9 /100 | #184 | Average 4.5% |
| Immigrants | Philippines | 41.0 /100 | #185 | Average 4.5% |
| Hawaiians | 39.1 /100 | #186 | Fair 4.5% |
| Immigrants | Ukraine | 36.8 /100 | #187 | Fair 4.5% |
| Immigrants | Sierra Leone | 36.3 /100 | #188 | Fair 4.6% |
| Immigrants | Laos | 35.7 /100 | #189 | Fair 4.6% |
| Immigrants | Serbia | 34.8 /100 | #190 | Fair 4.6% |
| Immigrants | Uruguay | 34.4 /100 | #191 | Fair 4.6% |
| Immigrants | Thailand | 34.1 /100 | #192 | Fair 4.6% |
| Immigrants | Lithuania | 33.2 /100 | #193 | Fair 4.6% |
| South Americans | 32.9 /100 | #194 | Fair 4.6% |
| Peruvians | 31.5 /100 | #195 | Fair 4.6% |
| Estonians | 31.2 /100 | #196 | Fair 4.6% |